Page 359 - Advanced engineering mathematics
P. 359

10.6 Phase Portraits  339
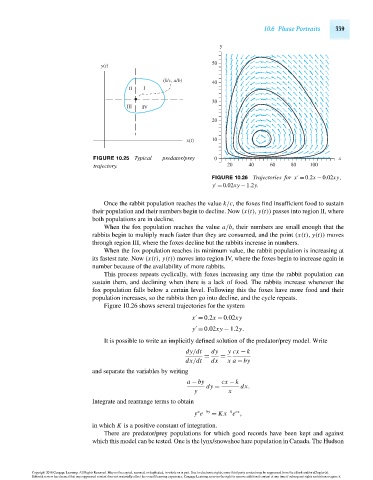

                                                                               y

                                                                            50
                                           y(t)
                                                             (k/c, a/b)
                                                                            40
                                                   II  I
                                                                            30
                                                  III  IV
                                                                            20


                                                                     x(t)   10

                                        FIGURE 10.25 Typical  predator/prey  0                                     x
                                        trajectory.                              20    40     60    80    100
                                                                            FIGURE 10.26 Trajectories for x = 0.2x − 0.02xy,


                                                                            y = 0.02xy − 1.2y.
                                           Once the rabbit population reaches the value k/c, the foxes find insufficient food to sustain
                                        their population and their numbers begin to decline. Now (x(t), y(t)) passes into region II, where
                                        both populations are in decline.
                                           When the fox population reaches the value a/b, their numbers are small enough that the
                                        rabbits begin to multiply much faster than they are consumed, and the point (x(t), y(t)) moves
                                        through region III, where the foxes decline but the rabbits increase in numbers.
                                           When the fox population reaches its minimum value, the rabbit population is increasing at
                                        its fastest rate. Now (x(t), y(t)) moves into region IV, where the foxes begin to increase again in
                                        number because of the availability of more rabbits.
                                           This process repeats cyclically, with foxes increasing any time the rabbit population can
                                        sustain them, and declining when there is a lack of food. The rabbits increase whenever the
                                        fox population falls below a certain level. Following this the foxes have more food and their
                                        population increases, so the rabbits then go into decline, and the cycle repeats.
                                           Figure 10.26 shows several trajectories for the system

                                                                      x = 0.2x − 0.02xy


                                                                      y = 0.02xy − 1.2y.
                                           It is possible to write an implicitly defined solution of the predator/prey model. Write
                                                                    dy/dt   dy   y cx − k
                                                                          =    =
                                                                    dx/dt   dx   x a − by
                                        and separate the variables by writing
                                                                     a − by    cx − k
                                                                           dy =      dx.
                                                                       y         x
                                        Integrate and rearrange terms to obtain

                                                                                 −k cx
                                                                        a −by
                                                                       y e  = Kx e ,
                                        in which K is a positive constant of integration.
                                           There are predator/prey populations for which good records have been kept and against
                                        which this model can be tested. One is the lynx/snowshoe hare population in Canada. The Hudson


                      Copyright 2010 Cengage Learning. All Rights Reserved. May not be copied, scanned, or duplicated, in whole or in part. Due to electronic rights, some third party content may be suppressed from the eBook and/or eChapter(s).
                      Editorial review has deemed that any suppressed content does not materially affect the overall learning experience. Cengage Learning reserves the right to remove additional content at any time if subsequent rights restrictions require it.

                                   October 14, 2010  20:32  THM/NEIL   Page-339        27410_10_ch10_p295-342
   354   355   356   357   358   359   360   361   362   363   364