Page 361 - Advanced engineering mathematics
P. 361

10.6 Phase Portraits  341


                                                                               y

                               y(t)

                                                                             60
                                              II

                                                                             40
                                   III      (k/c, a/b)
                                                          I
                                                                             20
                                             IV
                                                                x(t)

                                                                              0                                     x
                            FIGURE 10.27 Trajectories for a typical competing
                                                                                   20   40  60   80  100  120  140
                            species model.

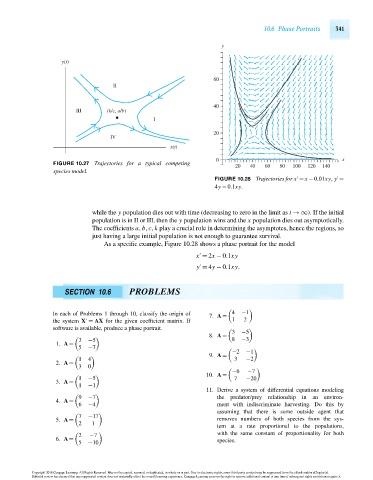
                                                                             FIGURE 10.28 Trajectories for x = x −0.01xy, y =
                                                                             4y − 0.1xy.


                                        while the y population dies out with time (decreasing to zero in the limit as t →∞). If the initial
                                        population is in II or III, then the y population wins and the x population dies out asymptotically.
                                        The coefficients a,b,c,k play a crucial role in determining the asymptotes, hence the regions, so
                                        just having a large initial population is not enough to guarantee survival.
                                           As a specific example, Figure 10.28 shows a phase portrait for the model

                                                                       x = 2x − 0.1xy

                                                                        y = 4y − 0.1xy.

                               SECTION 10.6        PROBLEMS


                            In each of Problems 1 through 10, classify the origin of  4  −1
                                                                           7. A =

                            the system X = AX for the given coefficient matrix. If  1  2
                            software is available, produce a phase portrait.
                                                                                  3  −5
                                                                           8. A =

                                    3  −5                                         8  −3
                             1. A =
                                    5  −7
                                                                                  −2   −1
                                                                           9. A =

                                    1  4                                           3   −2
                             2. A =
                                    3  0
                                                                                  −6   −7

                                         	                                 10. A =
                                    1  −5                                          7   −20
                             3. A =
                                    1  −1
                                                                           11. Derive a system of differential equations modeling

                                    9  −7                                     the  predator/prey  relationship  in  an  environ-
                             4. A =
                                    6  −4                                     ment with indiscriminate harvesting. Do this by
                                                                              assuming that there is some outside agent that

                                    7  −17
                             5. A =                                           removes numbers of both species from the sys-
                                    2   1
                                                                              tem at a rate proportional to the populations,
                                          	                                   with the same constant of proportionality for both
                                    2  −7
                             6. A =                                           species.
                                    5  −10
                      Copyright 2010 Cengage Learning. All Rights Reserved. May not be copied, scanned, or duplicated, in whole or in part. Due to electronic rights, some third party content may be suppressed from the eBook and/or eChapter(s).
                      Editorial review has deemed that any suppressed content does not materially affect the overall learning experience. Cengage Learning reserves the right to remove additional content at any time if subsequent rights restrictions require it.
                                   October 14, 2010  20:32  THM/NEIL   Page-341        27410_10_ch10_p295-342
   356   357   358   359   360   361   362   363   364   365   366