
Page 397 - Advanced thermodynamics for engineers
P. 397
17.2 SIMPLE GAS TURBINE CYCLE ANALYSIS 387
and then
T 1
b h ¼ 1 (17.12)
T 3
so that the efficiency of this cycle is the Carnot efficiency. However, if b r p is used this also implies that
the full temperature rise occurs through compression without any fuel addition and hence the cycle is
of infinitesimal width and produces no work.
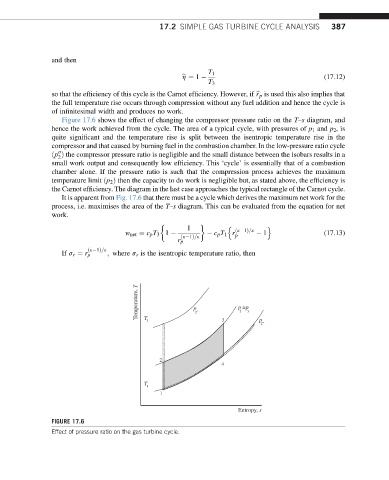
Figure 17.6 shows the effect of changing the compressor pressure ratio on the T–s diagram, and
hence the work achieved from the cycle. The area of a typical cycle, with pressures of p 1 and p 2 ,is
quite significant and the temperature rise is split between the isentropic temperature rise in the
compressor and that caused by burning fuel in the combustion chamber. In the low-pressure ratio cycle
ðp Þ the compressor pressure ratio is negligible and the small distance between the isobars results in a
00
2
small work output and consequently low efficiency. This ‘cycle’ is essentially that of a combustion
chamber alone. If the pressure ratio is such that the compression process achieves the maximum
temperature limit ðp 2 Þ then the capacity to do work is negligible but, as stated above, the efficiency is
the Carnot efficiency. The diagram in the last case approaches the typical rectangle of the Carnot cycle.
It is apparent from Fig. 17.6 that there must be a cycle which derives the maximum net work for the
process, i.e. maximises the area of the T–s diagram. This can be evaluated from the equation for net
work.
1 n o
w net ¼ c p T 3 1 c p T 1 r ðk 1Þ=k 1 (17.13)
p
ðk 1Þ=k
r p
ðk 1Þ=k
If s r ¼ r p ; where s r is the isentropic temperature ratio, then
Temperature, T p p =p 3
2
T
3 2’ 3 p
2“
2
4
T
1
1
Entropy, s
FIGURE 17.6
Effect of pressure ratio on the gas turbine cycle.