
Page 402 - Advanced thermodynamics for engineers
P. 402
392 CHAPTER 17 GAS TURBINES
4.0
3.5
Isentropic temperature ratio 3.0
2.5
2.0
1.5
1.0
0 10 20 30 40 50 60 70 80 90 100
Pressure ratio
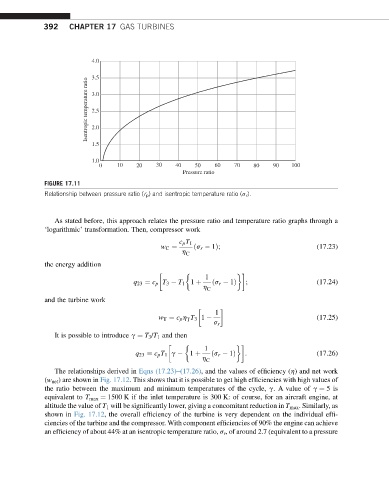
FIGURE 17.11
Relationship between pressure ratio (r p ) and isentropic temperature ratio (s r ).
As stated before, this approach relates the pressure ratio and temperature ratio graphs through a
‘logarithmic’ transformation. Then, compressor work
c p T 1
w C ¼ ðs r 1Þ; (17.23)
h C
the energy addition
1
q 23 ¼ c p T 3 T 1 1 þ ðs r 1Þ ; (17.24)
h C
and the turbine work
1
w T ¼ c p h T 3 1 (17.25)
T
s r
It is possible to introduce g ¼ T 3 /T 1 and then
1
q 23 ¼ c p T 1 g 1 þ ðs r 1Þ : (17.26)
h C
The relationships derived in Eqns (17.23)–(17.26), and the values of efficiency (h) and net work
(w net ) are shown in Fig. 17.12. This shows that it is possible to get high efficiencies with high values of
the ratio between the maximum and minimum temperatures of the cycle, g. A value of g ¼ 5is
equivalent to T max ¼ 1500 K if the inlet temperature is 300 K: of course, for an aircraft engine, at
altitude the value of T 1 will be significantly lower, giving a concomitant reduction in T max . Similarly, as
shown in Fig. 17.12, the overall efficiency of the turbine is very dependent on the individual effi-
ciencies of the turbine and the compressor. With component efficiencies of 90% the engine can achieve
an efficiency of about 44% at an isentropic temperature ratio, s r , of around 2.7 (equivalent to a pressure