
Page 403 - Advanced thermodynamics for engineers
P. 403
17.2 SIMPLE GAS TURBINE CYCLE ANALYSIS 393
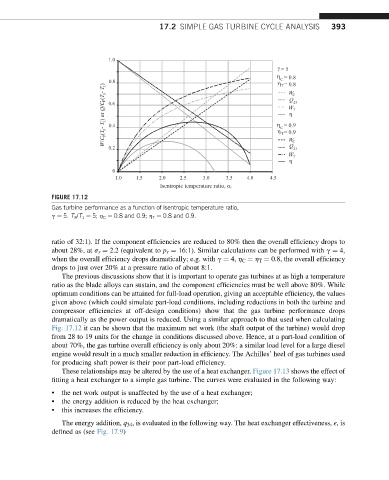
FIGURE 17.12
Gas turbine performance as a function of isentropic temperature ratio,
g ¼ 5. T 3 /T 1 ¼ 5; h C ¼ 0.8 and 0.9; h T ¼ 0.8 and 0.9.
ratio of 32:1). If the component efficiencies are reduced to 80% then the overall efficiency drops to
about 28%, at s r ¼ 2.2 (equivalent to p r ¼ 16:1). Similar calculations can be performed with g ¼ 4,
when the overall efficiency drops dramatically; e.g. with g ¼ 4, h C ¼ h T ¼ 0.8, the overall efficiency
drops to just over 20% at a pressure ratio of about 8:1.
The previous discussions show that it is important to operate gas turbines at as high a temperature
ratio as the blade alloys can sustain, and the component efficiencies must be well above 80%. While
optimum conditions can be attained for full-load operation, giving an acceptable efficiency, the values
given above (which could simulate part-load conditions, including reductions in both the turbine and
compressor efficiencies at off-design conditions) show that the gas turbine performance drops
dramatically as the power output is reduced. Using a similar approach to that used when calculating
Fig. 17.12 it can be shown that the maximum net work (the shaft output of the turbine) would drop
from 28 to 19 units for the change in conditions discussed above. Hence, at a part-load condition of
about 70%, the gas turbine overall efficiency is only about 20%: a similar load level for a large diesel
engine would result in a much smaller reduction in efficiency. The Achilles’ heel of gas turbines used
for producing shaft power is their poor part-load efficiency.
These relationships may be altered by the use of a heat exchanger. Figure 17.13 shows the effect of
fitting a heat exchanger to a simple gas turbine. The curves were evaluated in the following way:
• the net work output is unaffected by the use of a heat exchanger;
• the energy addition is reduced by the heat exchanger;
• this increases the efficiency.
The energy addition, q 34 , is evaluated in the following way. The heat exchanger effectiveness, ε,is
defined as (see Fig. 17.9)