
Page 405 - Advanced thermodynamics for engineers
P. 405
17.2 SIMPLE GAS TURBINE CYCLE ANALYSIS 395
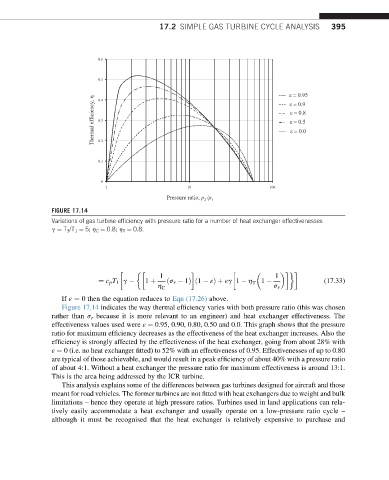
FIGURE 17.14
Variations of gas turbine efficiency with pressure ratio for a number of heat exchanger effectivenesses
g ¼ T 3 /T 1 ¼ 5; h C ¼ 0.8; h T ¼ 0.8.
1 1
¼ c p T 1 g 1 þ ðs r 1Þ ð1 εÞþ εg 1 h T 1 (17.33)
h C s r
If ε ¼ 0 then the equation reduces to Eqn (17.26) above.
Figure 17.14 indicates the way thermal efficiency varies with both pressure ratio (this was chosen
rather than s r because it is more relevant to an engineer) and heat exchanger effectiveness. The
effectiveness values used were ε ¼ 0.95, 0.90, 0.80, 0.50 and 0.0. This graph shows that the pressure
ratio for maximum efficiency decreases as the effectiveness of the heat exchanger increases. Also the
efficiency is strongly affected by the effectiveness of the heat exchanger, going from about 28% with
ε ¼ 0 (i.e. no heat exchanger fitted) to 52% with an effectiveness of 0.95. Effectivenesses of up to 0.80
are typical of those achievable, and would result in a peak efficiency of about 40% with a pressure ratio
of about 4:1. Without a heat exchanger the pressure ratio for maximum effectiveness is around 13:1.
This is the area being addressed by the ICR turbine.
This analysis explains some of the differences between gas turbines designed for aircraft and those
meant for road vehicles. The former turbines are not fitted with heat exchangers due to weight and bulk
limitations – hence they operate at high pressure ratios. Turbines used in land applications can rela-
tively easily accommodate a heat exchanger and usually operate on a low-pressure ratio cycle –
although it must be recognised that the heat exchanger is relatively expensive to purchase and