
Page 64 - Advanced thermodynamics for engineers
P. 64
48 CHAPTER 3 ENGINE CYCLES AND THEIR EFFICIENCIES
(a) Constant (b)
pressure 3 2 3 Incremental cycle
Temperature, T Constant Pressure, p Isentropic
volume
2
4
4
Constant
pressure
Isentropic
1 Constant
volume 1
Specific entropy, s Volume, V
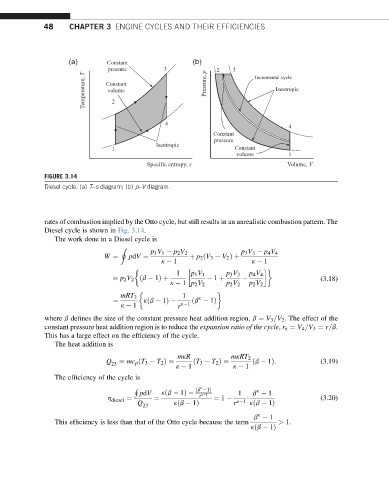
FIGURE 3.14
Diesel cycle. (a) T–s diagram; (b) p–V diagram.
rates of combustion implied by the Otto cycle, but still results in an unrealistic combustion pattern. The
Diesel cycle is shown in Fig. 3.14.
The work done in a Diesel cycle is
I
p 1 V 1 p 2 V 2 p 3 V 3 p 4 V 4
W ¼ pdV ¼ þ p 2 ðV 3 V 2 Þþ
k 1 k 1
1 p 1 V 1 p 3 V 3 p 4 V 4
¼ p 2 V 2 ðb 1Þþ 1 þ (3.18)
k 1 p 2 V 2 p 2 V 2 p 2 V 2
mRT 2 1 k
¼ kðb 1Þ ðb 1Þ
k 1 r k 1
where b defines the size of the constant pressure heat addition region, b ¼ V 3 =V 2 . The effect of the
constant pressure heat addition region is to reduce the expansion ratio of the cycle, r e ¼ V 4 =V 3 ¼ r=b.
This has a large effect on the efficiency of the cycle.
The heat addition is
mkR mkRT 2
Q 23 ¼ mc p ðT 3 T 2 Þ¼ k 1 ðT 3 T 2 Þ¼ k 1 ðb 1Þ: (3.19)
The efficiency of the cycle is
k
H ðb 1Þ k
pdV kðb 1Þ r k 1 1 b 1
h diesel ¼ ¼ ¼ 1 $ (3.20)
Q 23 kðb 1Þ r k 1 kðb 1Þ
k
b 1
This efficiency is less than that of the Otto cycle because the term > 1.
kðb 1Þ