
Page 132 - Advances in Biomechanics and Tissue Regeneration
P. 132
128 7. MULTISCALE NUMERICAL SIMULATION OF HEART ELECTROPHYSIOLOGY
The procedure followed consisted of modifying the original formulation for the f ATP proposed by Ferrero et al. [48]
in order to fit the data from Fig. 7.4 for different cell types. The maximal conductance for the I KATP was modified to
adjust the experimental observations on the AP duration (APD) by Furukawa et al. [60]. In other words, this is a 50%
reduction in the APD under conditions of hypoxia and hyperkalemia for the epicardium, and a 10% reduction under
the same conditions for the endocardium. For the midmyocardium, there are no experimental data available regarding
the behavior of K ATP channels. For this case, we have adjusted the value of f ATP such that the same reduction in APD as
for epicardial cells was obtained without modifying the maximal conductance of the channel, as proposed by others
[64, 65]. In addition, for physiological values of [ATP] i and [ADP] i , the APD and the resting potential should not be
affected by the presence of the I KATP current in the AP model. Hence, the I KATP current has been formulated as [48]
+ 0:24
o
½K (7.46)
I KATP ¼ g 0 f M f N f T f ATP ðV E K Þ,
5:4
+
2+
where g 0 is the maximum channel conductance in the absence of Na ,Mg , and ATP; f M , f N , and f T are correction
factors; f ATP is the fraction of opened channels; V is the transmembrane potential; and E K is the inversion potential
of the channel. The maximum channel conductance and the fraction of opened channels, f ATP , have been modified with
respect to their original formulation
1
, (7.47)
H
f ATP ¼
i
1+ ð½ATP =K m Þ
where [ATP] i is the intracellular concentration of ATP, and K m (in mmol/L) and H (–) are given as
0:256
K m ¼ αð35:8+17:9½ADP i Þ, (7.48)
H ¼ 1:3+0:74βexpð 0:09½ADP Þ, (7.49)
i
where [ADP] i is the intracellular concentration of ADP in μmol/L, and α and β are fitting parameters that account for
the cellular heterogeneity. Parameters α and β were identified by fitting experimental data available for different ani-
mal models from Fig. 7.4. To adjust g 0 , 100 stimuli at a basic cycle length (CL) of 1000 ms were applied to an isolated
cell. The APD at the last stimulus was measured under physiological and pathological conditions. The variation in
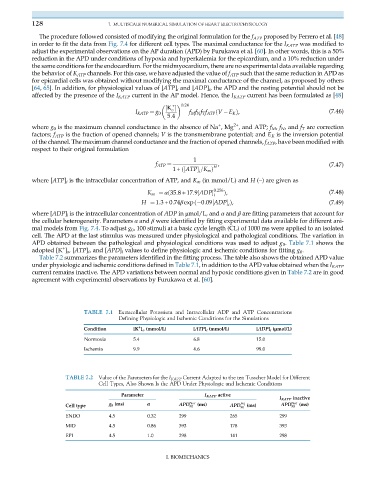
APD obtained between the pathological and physiological conditions was used to adjust g 0 . Table 7.1 shows the
+
adopted [K ] o ,[ATP] i , and [APD] i values to define physiologic and ischemic conditions for fitting g 0 .
Table 7.2 summarizes the parameters identified in the fitting process. The table also shows the obtained APD value
under physiologic and ischemic conditions defined in Table 7.1, in addition to the APD value obtained when the I KATP
current remains inactive. The APD variations between normal and hypoxic conditions given in Table 7.2 are in good
agreement with experimental observations by Furukawa et al. [60].
TABLE 7.1 Extracellular Potassium and Intracellular ADP and ATP Concentrations
Defining Physiologic and Ischemic Conditions for the Simulations
+
Condition [K ] o (mmol/L) [ATP] i (mmol/L) [ADP] i (μmol/L)
Normoxia 5.4 6.8 15.0
Ischemia 9.9 4.6 99.0
TABLE 7.2 Value of the Parameters for the I KATP Current Adapted to the ten Tusscher Model for Different
Cell Types, Also Shown Is the APD Under Physiologic and Ischemic Conditions
Parameter I KATP active
I KATP inactive
Cell type g 0 (ms) α APD Nor (ms) APD Isq (ms) APD Nor (ms)
90
90
90
ENDO 4.5 0.32 299 265 299
MID 4.5 0.86 393 178 393
EPI 4.5 1.0 298 141 298
I. BIOMECHANICS