
Page 160 - Advances in Biomechanics and Tissue Regeneration
P. 160
156 8. TOWARDS THE REAL-TIME MODELING OF THE HEART
(A)
(B)
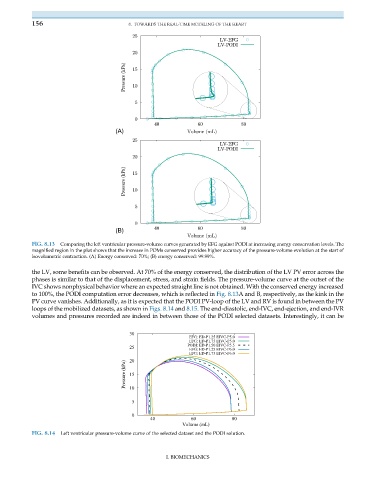
FIG. 8.13 Comparing the left ventricular pressure-volume curves generated by EFG against PODI at increasing energy conservation levels. The
magnified region in the plot shows that the increase in POMs conserved provides higher accuracy of the pressure-volume evolution at the start of
isovolumetric contraction. (A) Energy conserved: 70%; (B) energy conserved: 99.99%.
the LV, some benefits can be observed. At 70% of the energy conserved, the distribution of the LV PV error across the
phases is similar to that of the displacement, stress, and strain fields. The pressure-volume curve at the outset of the
IVC shows nonphysical behavior where an expected straight line is not obtained. With the conserved energy increased
to 100%, the PODI computation error decreases, which is reflected in Fig. 8.13A and B, respectively, as the kink in the
PV curve vanishes. Additionally, as it is expected that the PODI PV-loop of the LV and RV is found in between the PV
loops of the mobilized datasets, as shown in Figs. 8.14 and 8.15. The end-diastolic, end-IVC, end-ejection, and end-IVR
volumes and pressures recorded are indeed in between those of the PODI selected datasets. Interestingly, it can be
30
EFG: ED-P1.25 EIVC-P5.0
EFG: ED-P1.75 EIVC-P5.0
25 PODI: ED-P1.50 EIVC-P5.5
EFG: ED-P1.25 EIVC-P6.0
EFG: ED-P1.75 EIVC-P6.0
20
Pressure (kPa) 15
10
5
0
40 60 80
Volume (mL)
FIG. 8.14 Left ventricular pressure-volume curve of the selected dataset and the PODI solution.
I. BIOMECHANICS