Page 157 - Advances in Biomechanics and Tissue Regeneration
P. 157

8.4 WHOLE HEART CYCLE MODELING                              153


                                                      0.007845                      0.11131
                                                      -0.0014151                    0.089312
                                                      -0.010675                     0.067318
                                                      -0.019935                     0.045324
                                                      -0.029196                     0.02333
                                                      -0.038456                     0.0013361
                                                      -0.047716                     -0.020658
                                                      -0.056976                     -0.042652
                                                      -0.066236                     -0.064646
                                    (A)               -0.075496    (B)              -0.08664


                                                      0.065121                      0.071943
                                                      0.044642                      0.058275
                                                      0.024164                      0.044606
                                                      0.003686                      0.030937
                                                      -0.016792                     0.017269
                                                      -0.03727                      0.0036002
                                                      -0.057748                     -0.010068
                                                      -0.078227                     -0.023737
                                                      -0.098705                     -0.037406
                                     (C)              -0.11918     (D)              -0.051074


                                                      0.048283                     0.00017116
                                                      0.033695                     0.00014108
                                                      0.019106                     0.00011101
                                                      0.0045171                    8.0939e-05
                                                      -0.010072                    5.0866e-05
                                                      -0.02466                     2.0794e-05
                                                      -0.039249                    -9.2783e-06
                                                      -0.053838                    -3.9351e-05
                                                      -0.068427                    -6.9423e-05
                                     (E)              -0.083016    (F)             -9.9495e-05


                                                                       0.16007
                                                                       0.052849
                                                                       -0.054371
                                                                       -0.16159
                                                                       -0.26881
                                                                       -0.37603
                                                                       -0.48325
                                                                       -0.59047
                                                                       -0.69769
                                                      (G)              -0.80491
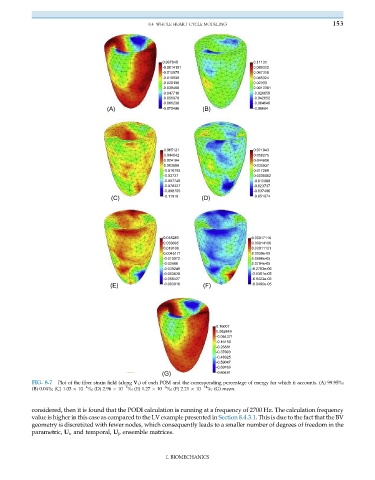
           FIG. 8.7  Plot of the fiber strain field (along V 1 ) of each POM and the corresponding percentage of energy for which it accounts. (A) 99.95%;
                                          7
                                                       8
                             4
           (B) 0.04%; (C) 1.03   10 %; (D) 2.96   10 %; (E) 1.27   10 %; (F) 2.21   10  14 %; (G) mean.
           considered, then it is found that the PODI calculation is running at a frequency of 2700 Hz. The calculation frequency
           value is higher in this case as compared to the LV example presented in Section 8.4.3.1. This is due to the fact that the BV
           geometry is discretized with fewer nodes, which consequently leads to a smaller number of degrees of freedom in the
           parametric, U i , and temporal, U j , ensemble matrices.


                                                       I. BIOMECHANICS
   152   153   154   155   156   157   158   159   160   161   162