
Page 161 - Advances in Biomechanics and Tissue Regeneration
P. 161
8.4 WHOLE HEART CYCLE MODELING 157
12
EFG: ED-P1.25 EIVC-P5.0
EFG: ED-P1.75 EIVC-P5.0
PODI: ED-P1.50 EIVC-P5.5
10
EFG: ED-P1.25 EIVC-P6.0
EFG: ED-P1.75 EIVC-P6.0
8
Pressure (kPa) 6
4
2
0
12 14 16 18
Volume (mL)
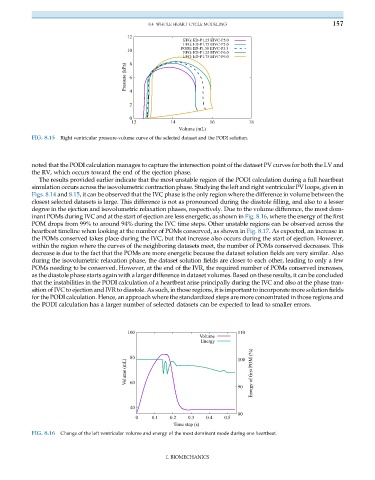
FIG. 8.15 Right ventricular pressure-volume curve of the selected dataset and the PODI solution.
noted that the PODI calculation manages to capture the intersection point of the dataset PV curves for both the LV and
the RV, which occurs toward the end of the ejection phase.
The results provided earlier indicate that the most unstable region of the PODI calculation during a full heartbeat
simulation occurs across the isovolumetric contraction phase. Studying the left and right ventricular PV loops, given in
Figs. 8.14 and 8.15, it can be observed that the IVC phase is the only region where the difference in volume between the
closest selected datasets is large. This difference is not as pronounced during the diastole filling, and also to a lesser
degree in the ejection and isovolumetric relaxation phases, respectively. Due to the volume difference, the most dom-
inant POMs during IVC and at the start of ejection are less energetic, as shown in Fig. 8.16, where the energy of the first
POM drops from 99% to around 94% during the IVC time steps. Other unstable regions can be observed across the
heartbeat timeline when looking at the number of POMs conserved, as shown in Fig. 8.17. As expected, an increase in
the POMs conserved takes place during the IVC, but that increase also occurs during the start of ejection. However,
within the region where the curves of the neighboring datasets meet, the number of POMs conserved decreases. This
decrease is due to the fact that the POMs are more energetic because the dataset solution fields are very similar. Also
during the isovolumetric relaxation phase, the dataset solution fields are closer to each other, leading to only a few
POMs needing to be conserved. However, at the end of the IVR, the required number of POMs conserved increases,
as the diastole phase starts again with a larger difference in dataset volumes. Based on these results, it can be concluded
that the instabilities in the PODI calculation of a heartbeat arise principally during the IVC and also at the phase tran-
sition of IVC to ejection and IVR to diastole. As such, in those regions, it is important to incorporate more solution fields
for the PODI calculation. Hence, an approach where the standardized steps are more concentrated in those regions and
the PODI calculation has a larger number of selected datasets can be expected to lead to smaller errors.
100 110
Volume
Energy
80 100
Volume (mL) Energy of first POM (%)
60
90
40
80
0 0.1 0.2 0.3 0.4 0.5
Time step (s)
FIG. 8.16 Change of the left ventricular volume and energy of the most dominant mode during one heartbeat.
I. BIOMECHANICS