
Page 177 - Advances in Biomechanics and Tissue Regeneration
P. 177
8.5 PATIENT-SPECIFIC CARDIAC PODI COMPUTATION 173
TABLE 8.11 Mesh Discretization Refinement Levels of the Heart Grid Template
Heart grid HG-1 HG-2 HG-3 HG-4 HG-5
Nodes 347 448 533 714 977
template is labeled as HG-1 while the refined discretization models are labeled HG-2 to HG-5 where Table 8.11 lists the
respective nodal numbers.
Using the new refined heart templates, the performance improvement is separately investigated for the registration
of the dataset and the problem-at-hand geometries, and also for the projection of the solution fields to and from the
template geometry. Starting with the CPD registration, the mean distance between the nodes, the average minimum
element angle, and the element shape are the criteria used to assess the quality of the registration. The compiled results
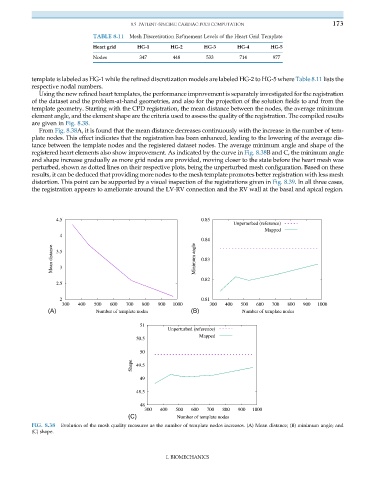
are given in Fig. 8.38.
From Fig. 8.38A, it is found that the mean distance decreases continuously with the increase in the number of tem-
plate nodes. This effect indicates that the registration has been enhanced, leading to the lowering of the average dis-
tance between the template nodes and the registered dataset nodes. The average minimum angle and shape of the
registered heart elements also show improvement. As indicated by the curve in Fig. 8.38B and C, the minimum angle
and shape increase gradually as more grid nodes are provided, moving closer to the state before the heart mesh was
perturbed, shown as dotted lines on their respective plots, being the unperturbed mesh configuration. Based on these
results, it can be deduced that providing more nodes to the mesh template promotes better registration with less mesh
distortion. This point can be supported by a visual inspection of the registrations given in Fig. 8.39. In all three cases,
the registration appears to ameliorate around the LV-RV connection and the RV wall at the basal and apical region.
4.5 0.85
Unperturbed (reference)
Mapped
4
0.84
Mean distance 3.5 Minimum angle 0.83
3
0.82
2.5
2 0.81
300 400 500 600 700 800 900 1000 300 400 500 600 700 800 900 1000
(A) Number of template nodes (B) Number of template nodes
51
Unperturbed (reference)
Mapped
50.5
50
Shape 49.5
49
48.5
48
300 400 500 600 700 800 900 1000
(C) Number of template nodes
FIG. 8.38 Evolution of the mesh quality measures as the number of template nodes increases. (A) Mean distance; (B) minimum angle; and
(C) shape.
I. BIOMECHANICS