
Page 178 - Advances in Biomechanics and Tissue Regeneration
P. 178
174 8. TOWARDS THE REAL-TIME MODELING OF THE HEART
(A) (B) (C)
FIG. 8.39 Registration of perturbed BV-1, BV-2, and BV-3 meshes. (A) Model BV-1C registered on HG1. (B) Model BV-1C registered on HG3.
(C) Model BV-1C registered on HG5.
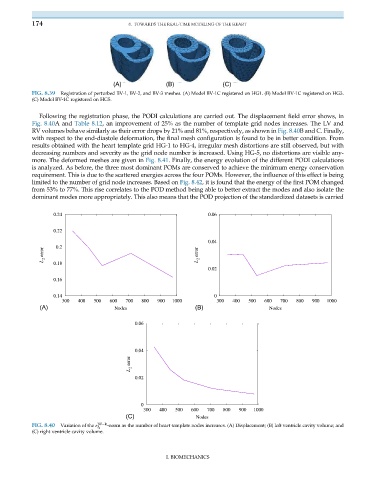
Following the registration phase, the PODI calculations are carried out. The displacement field error shows, in
Fig. 8.40A and Table 8.12, an improvement of 25% as the number of template grid nodes increases. The LV and
RV volumes behave similarly as their error drops by 21% and 81%, respectively, as shown in Fig. 8.40B and C. Finally,
with respect to the end-diastole deformation, the final mesh configuration is found to be in better condition. From
results obtained with the heart template grid HG-1 to HG-4, irregular mesh distortions are still observed, but with
decreasing numbers and severity as the grid node number is increased. Using HG-5, no distortions are visible any-
more. The deformed meshes are given in Fig. 8.41. Finally, the energy evolution of the different PODI calculations
is analyzed. As before, the three most dominant POMs are conserved to achieve the minimum energy conservation
requirement. This is due to the scattered energies across the four POMs. However, the influence of this effect is being
limited to the number of grid node increases. Based on Fig. 8.42, it is found that the energy of the first POM changed
from 53% to 77%. This rise correlates to the POD method being able to better extract the modes and also isolate the
dominant modes more appropriately. This also means that the POD projection of the standardized datasets is carried
0.24 0.06
0.22
0.04
0.2
L 2 error L 2 error
0.18
0.02
0.16
0.14 0
300 400 500 600 700 800 900 1000 300 400 500 600 700 800 900 1000
(A) Nodes (B) Nodes
0.06
0.04
L 2 error
0.02
0
300 400 500 600 700 800 900 1000
(C) Nodes
FIG. 8.40 Variation of the ε BV R -norm as the number of heart template nodes increases. (A) Displacement; (B) left ventricle cavity volume; and
‘ 2
(C) right ventricle cavity volume.
I. BIOMECHANICS