
Page 125 - Advances in Renewable Energies and Power Technologies
P. 125
98 CHAPTER 3 Forecasting of Intermittent Solar Energy Resource
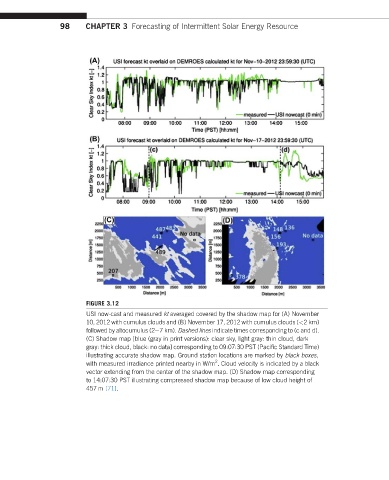
FIGURE 3.12
USI now-cast and measured kt averaged covered by the shadow map for (A) November
10, 2012 with cumulus clouds and (B) November 17, 2012 with cumulus clouds (<2 km)
followed by altocumulus (2e7km). Dashed lines indicate times corresponding to (c and d).
(C) Shadow map [blue (gray in print versions): clear sky, light gray: thin cloud, dark
gray: thick cloud, black: no data] corresponding to 09:07:30 PST (Pacific Standard Time)
illustrating accurate shadow map. Ground station locations are marked by black boxes,
2
with measured irradiance printed nearby in W/m . Cloud velocity is indicated by a black
vector extending from the center of the shadow map. (D) Shadow map corresponding
to 14:07:30 PST illustrating compressed shadow map because of low cloud height of
457 m [71].