
Page 248 - Advances in Renewable Energies and Power Technologies
P. 248
5. Flexible Active Power Control of PV Systems 221
(A) (B)
3.5
3.0
Available power Available power
PVpower P pv (kW) 2.0 P limit P limit
2.5
1.5
1.0
0.5 P pv P pv
0 2 4 6 8 10 12 14 16 18 20 22 24 0 2 4 6 8 10 12 14 16 18 20 22 24
Time (minutes) Time (minutes)
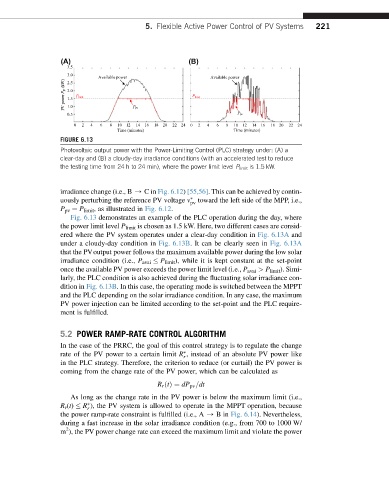
FIGURE 6.13
Photovoltaic output power with the Power-Limiting Control (PLC) strategy under: (A) a
clear-day and (B) a cloudy-day irradiance conditions (with an accelerated test to reduce
the testing time from 24 h to 24 min), where the power limit level P limit is 1.5 kW.
irradiance change (i.e., B / Cin Fig. 6.12) [55,56]. This can be achieved by contin-
uously perturbing the reference PV voltage v toward the left side of the MPP, i.e.,
pv
P pv ¼ P limit , as illustrated in Fig. 6.12.
Fig. 6.13 demonstrates an example of the PLC operation during the day, where
the power limit level P limit is chosen as 1.5 kW. Here, two different cases are consid-
ered where the PV system operates under a clear-day condition in Fig. 6.13A and
under a cloudy-day condition in Fig. 6.13B. It can be clearly seen in Fig. 6.13A
that the PVoutput power follows the maximum available power during the low solar
irradiance condition (i.e., P avai P limit ), while it is kept constant at the set-point
once the available PV power exceeds the power limit level (i.e., P avai > P limit ). Simi-
larly, the PLC condition is also achieved during the fluctuating solar irradiance con-
dition in Fig. 6.13B. In this case, the operating mode is switched between the MPPT
and the PLC depending on the solar irradiance condition. In any case, the maximum
PV power injection can be limited according to the set-point and the PLC require-
ment is fulfilled.
5.2 POWER RAMP-RATE CONTROL ALGORITHM
In the case of the PRRC, the goal of this control strategy is to regulate the change
rate of the PV power to a certain limit R , instead of an absolute PV power like
r
in the PLC strategy. Therefore, the criterion to reduce (or curtail) the PV power is
coming from the change rate of the PV power, which can be calculated as
R r ðtÞ¼ dP pv =dt
As long as the change rate in the PV power is below the maximum limit (i.e.,
R r (t) R ), the PV system is allowed to operate in the MPPT operation, because
r
the power ramp-rate constraint is fulfilled (i.e., A / Bin Fig. 6.14). Nevertheless,
during a fast increase in the solar irradiance condition (e.g., from 700 to 1000 W/
2
m ), the PV power change rate can exceed the maximum limit and violate the power