
Page 33 - Advances in Renewable Energies and Power Technologies
P. 33
6 CHAPTER 1 Solar Cells and Arrays: Principles, Analysis, and Design
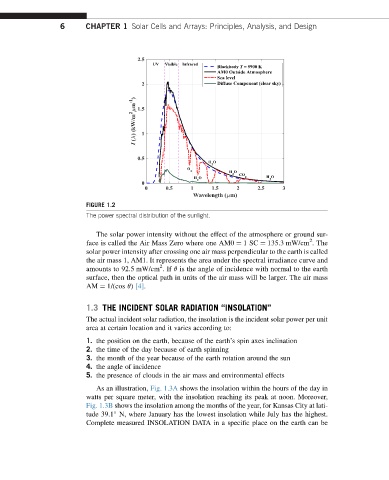
FIGURE 1.2
The power spectral distribution of the sunlight.
The solar power intensity without the effect of the atmosphere or ground sur-
2
face is called the Air Mass Zero where one AM0 ¼ 1SC ¼ 135.3 mW/cm .The
solar power intensity after crossing one air mass perpendicular to the earth is called
the air mass 1, AM1. It represents the area under the spectral irradiance curve and
2
amounts to 92.5 mW/cm .If q is the angle of incidence with normal to the earth
surface, then the optical path in units of the air mass will be larger. The air mass
AM ¼ 1/(cos q) [4].
1.3 THE INCIDENT SOLAR RADIATION “INSOLATION”
The actual incident solar radiation, the insolation is the incident solar power per unit
area at certain location and it varies according to:
1. the position on the earth, because of the earth’s spin axes inclination
2. the time of the day because of earth spinning
3. the month of the year because of the earth rotation around the sun
4. the angle of incidence
5. the presence of clouds in the air mass and environmental effects
As an illustration, Fig. 1.3A shows the insolation within the hours of the day in
watts per square meter, with the insolation reaching its peak at noon. Moreover,
Fig. 1.3B shows the insolation among the months of the year, for Kansas City at lati-
tude 39.1 N, where January has the lowest insolation while July has the highest.
Complete measured INSOLATION DATA in a specific place on the earth can be