
Page 96 - Advances in Renewable Energies and Power Technologies
P. 96
4. Conclusions and Future Works 69
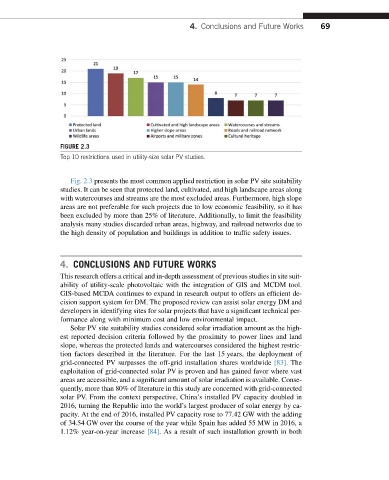
FIGURE 2.3
Top 10 restrictions used in utility-size solar PV studies.
Fig. 2.3 presents the most common applied restriction in solar PV site suitability
studies. It can be seen that protected land, cultivated, and high landscape areas along
with watercourses and streams are the most excluded areas. Furthermore, high slope
areas are not preferable for such projects due to low economic feasibility, so it has
been excluded by more than 25% of literature. Additionally, to limit the feasibility
analysis many studies discarded urban areas, highway, and railroad networks due to
the high density of population and buildings in addition to traffic safety issues.
4. CONCLUSIONS AND FUTURE WORKS
This research offers a critical and in-depth assessment of previous studies in site suit-
ability of utility-scale photovoltaic with the integration of GIS and MCDM tool.
GIS-based MCDA continues to expand in research output to offers an efficient de-
cision support system for DM. The proposed review can assist solar energy DM and
developers in identifying sites for solar projects that have a significant technical per-
formance along with minimum cost and low environmental impact.
Solar PV site suitability studies considered solar irradiation amount as the high-
est reported decision criteria followed by the proximity to power lines and land
slope, whereas the protected lands and watercourses considered the highest restric-
tion factors described in the literature. For the last 15 years, the deployment of
grid-connected PV surpasses the off-grid installation shares worldwide [83].The
exploitation of grid-connected solar PV is proven and has gained favor where vast
areas are accessible, and a significant amount of solar irradiation is available. Conse-
quently, more than 80% of literature in this study are concerned with grid-connected
solar PV. From the context perspective, China’s installed PV capacity doubled in
2016, turning the Republic into the world’s largest producer of solar energy by ca-
pacity. At the end of 2016, installed PV capacity rose to 77.42 GW with the adding
of 34.54 GW over the course of the year while Spain has added 55 MW in 2016, a
1.12% year-on-year increase [84]. As a result of such installation growth in both