
Page 330 -
P. 330
304 Chapter 8 ■ Classification
(continued)
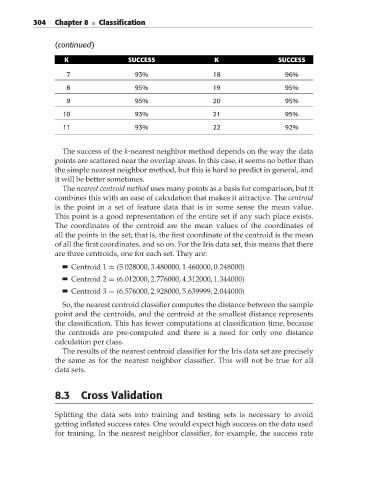
K SUCCESS K SUCCESS
7 93% 18 96%
8 95% 19 95%
9 95% 20 95%
10 93% 21 95%
11 93% 22 92%
The success of the k-nearest neighbor method depends on the way the data
points are scattered near the overlap areas. In this case, it seems no better than
the simple nearest neighbor method, but this is hard to predict in general, and
it will be better sometimes.
The nearest centroid method uses many points as a basis for comparison, but it
combines this with an ease of calculation that makes it attractive. The centroid
is the point in a set of feature data that is in some sense the mean value.
This point is a good representation of the entire set if any such place exists.
The coordinates of the centroid are the mean values of the coordinates of
all the points in the set; that is, the first coordinate of the centroid is the mean
of all the first coordinates, and so on. For the Iris data set, this means that there
are three centroids, one for each set. They are:
Centroid 1 = (5.028000, 3.480000, 1.460000, 0.248000)
Centroid 2 = (6.012000, 2.776000, 4.312000, 1.344000)
Centroid 3 = (6.576000, 2.928000, 5.639999, 2.044000)
So, the nearest centroid classifier computes the distance between the sample
point and the centroids, and the centroid at the smallest distance represents
the classification. This has fewer computations at classification time, because
the centroids are pre-computed and there is a need for only one distance
calculation per class.
Theresults of thenearest centroid classifierfor theIrisdataset areprecisely
the sameasfor thenearest neighbor classifier. This will notbetruefor all
data sets.
8.3 Cross Validation
Splitting the data sets into training and testing sets is necessary to avoid
getting inflated success rates. One would expect high success on the data used
for training. In the nearest neighbor classifier, for example, the success rate