
Page 329 -
P. 329
Chapter 8 ■ Classification 303
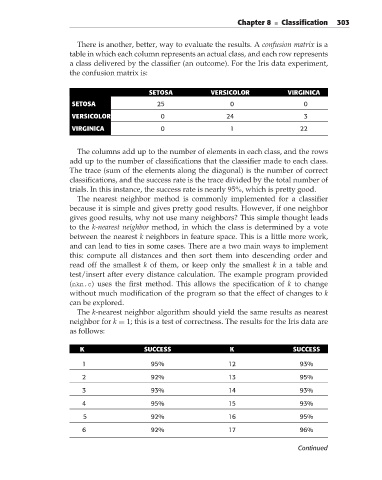
There is another, better, way to evaluate the results. A confusion matrix is a
table in which each column represents an actual class, and each row represents
a class delivered by the classifier (an outcome). For the Iris data experiment,
the confusion matrix is:
SETOSA VERSICOLOR VIRGINICA
SETOSA 25 0 0
VERSICOLOR 0 24 3
VIRGINICA 0 1 22
The columns add up to the number of elements in each class, and the rows
add up to the number of classifications that the classifier made to each class.
The trace (sum of the elements along the diagonal) is the number of correct
classifications, and the success rate is the trace divided by the total number of
trials. In this instance, the success rate is nearly 95%, which is pretty good.
The nearest neighbor method is commonly implemented for a classifier
because it is simple and gives pretty good results. However, if one neighbor
gives good results, why not use many neighbors? This simple thought leads
to the k-nearest neighbor method, in which the class is determined by a vote
between the nearest k neighbors in feature space. This is a little more work,
and can lead to ties in some cases. There are a two main ways to implement
this: compute all distances and then sort them into descending order and
read off the smallest k of them, or keep only the smallest k in a table and
test/insert after every distance calculation. The example program provided
(nkn.c) uses the first method. This allows the specification of k to change
without much modification of the program so that the effect of changes to k
can be explored.
The k-nearest neighbor algorithm should yield the same results as nearest
neighbor for k = 1; this is a test of correctness. The results for the Iris data are
as follows:
K SUCCESS K SUCCESS
1 95% 12 93%
2 92% 13 95%
3 93% 14 93%
4 95% 15 93%
5 92% 16 95%
6 92% 17 96%
Continued