
Page 331 -
P. 331
Chapter 8 ■ Classification 305
on the training data should be 100%, because each of the points will be a
distance of zero from at least one other — itself. Still, the selection of training
versus test data is arbitrary, and the two data sets could be exchanged without
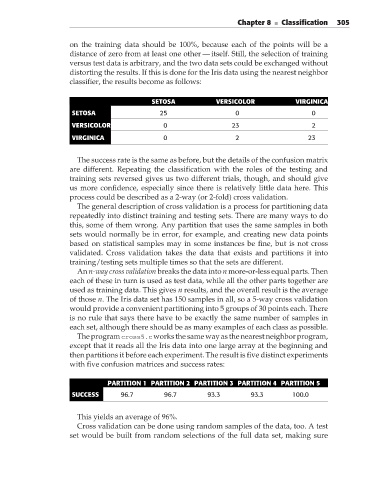
distorting the results. If this is done for the Iris data using the nearest neighbor
classifier, the results become as follows:
SETOSA VERSICOLOR VIRGINICA
SETOSA 25 0 0
VERSICOLOR 0 23 2
VIRGINICA 0 2 23
The success rate is the same as before, but the details of the confusion matrix
are different. Repeating the classification with the roles of the testing and
training sets reversed gives us two different trials, though, and should give
us more confidence, especially since there is relatively little data here. This
process could be described as a 2-way (or 2-fold) cross validation.
The general description of cross validation is a process for partitioning data
repeatedly into distinct training and testing sets. There are many ways to do
this, some of them wrong. Any partition that uses the same samples in both
sets would normally be in error, for example, and creating new data points
based on statistical samples may in some instances be fine, but is not cross
validated. Cross validation takes the data that exists and partitions it into
training/testing sets multiple times so that the sets are different.
An n-way cross validation breaks the data into n more-or-less equal parts. Then
each of these in turn is used as test data, while all the other parts together are
used as training data. This gives n results, and the overall result is the average
of those n. The Iris data set has 150 samples in all, so a 5-way cross validation
would provide a convenient partitioning into 5 groups of 30 points each. There
is no rule that says therehavetobeexactly thesamenumberofsamples in
each set, although there should be as many examples of each class as possible.
The program cross5.cworks the same way as the nearest neighbor program,
except that it reads all the Iris data into one large array at the beginning and
then partitions it before each experiment. The result is five distinct experiments
with five confusion matrices and success rates:
PARTITION 1 PARTITION 2 PARTITION 3 PARTITION 4 PARTITION 5
SUCCESS 96.7 96.7 93.3 93.3 100.0
This yields an average of 96%.
Cross validation can be done using random samples of the data, too. A test
set would be built from random selections of the full data set, making sure