
Page 422 -
P. 422
402 CHAPTER 9 PROJECT SCHEDULING: PERT/CPM
Managerial Report
Develop a report that presents the activity schedule and expected project completion time for the warehouse
expansion project. Include a project network in the report. In addition, take into consideration the following
issues.
1 R.C. Coleman’s top management established a required 40-week completion time for the project. Can this
completion time be achieved? Include probability information in your discussion. What recommendations
do you have if the 40-week completion time is required?
2 Suppose that management requests that activity times be shortened to provide an 80 per cent chance of
meeting the 40-week completion time. If the variance in the project completion time is the same as you
found in part (1), by how much should the expected project completion time be shortened to achieve the
goal of an 80 per cent chance of completion within 40 weeks?
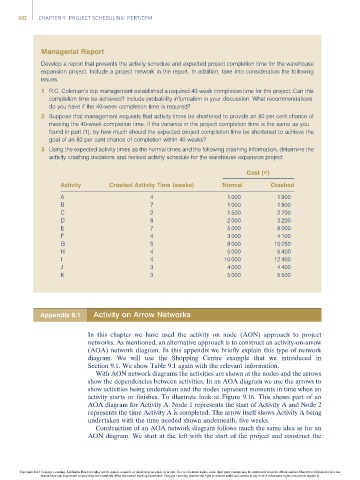
3 Using the expected activity times as the normal times and the following crashing information, determine the
activity crashing decisions and revised activity schedule for the warehouse expansion project.
Cost (E)
Activity Crashed Activity Time (weeks) Normal Crashed
A 4 1 000 1 900
B 7 1 000 1 800
C 2 1 500 2 700
D 8 2 000 3 200
E 7 5 000 8 000
F 4 3 000 4 100
G 5 8 000 10 250
H 4 5 000 6 400
I 4 10 000 12 400
J 3 4 000 4 400
K 3 5 000 5 500
Appendix 9.1 Activity on Arrow Networks
In this chapter we have used the activity on node (AON) approach to project
networks. As mentioned, an alternative approach is to construct an activity-on-arrow
(AOA) network diagram. In this appendix we briefly explain this type of network
diagram. We will use the Shopping Centre example that we introduced in
Section 9.1. We show Table 9.1 again with the relevant information.
With AON network diagrams the activities are shown at the nodes and the arrows
show the dependencies between activities. In an AOA diagram we use the arrows to
show activities being undertaken and the nodes represent moments in time when an
activity starts or finishes. To illustrate look at Figure 9.16. This shows part of an
AOA diagram for Activity A. Node 1 represents the start of Activity A and Node 2
represents the time Activity A is completed. The arrow itself shows Activity A being
undertaken with the time needed shown underneath, five weeks.
Construction of an AOA network diagram follows much the same idea as for an
AON diagram. We start at the left with the start of the project and construct the
Copyright 2014 Cengage Learning. All Rights Reserved. May not be copied, scanned, or duplicated, in whole or in part. Due to electronic rights, some third party content may be suppressed from the eBook and/or eChapter(s). Editorial review has
deemed that any suppressed content does not materially affect the overall learning experience. Cengage Learning reserves the right to remove additional content at any time if subsequent rights restrictions require it.