
Page 424 -
P. 424
404 CHAPTER 9 PROJECT SCHEDULING: PERT/CPM
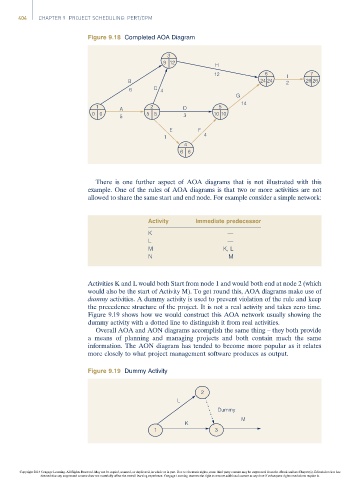
Figure 9.18 Completed AOA Diagram
3
912
H
12 6 I 7
B 24 24 2 26 26
6 C 4
G
14
1 A 2 D 5
00 5 55 3 10 10
E F
1 4
4
66
There is one further aspect of AOA diagrams that is not illustrated with this
example. One of the rules of AOA diagrams is that two or more activities are not
allowed to share the same start and end node. For example consider a simple network:
Activity Immediate predecessor
K —
L —
M K, L
N M
Activities K and L would both Start from node 1 and would both end at node 2 (which
would also be the start of Activity M). To get round this, AOA diagrams make use of
dummy activities. A dummy activity is used to prevent violation of the rule and keep
the precedence structure of the project. It is not a real activity and takes zero time.
Figure 9.19 shows how we would construct this AOA network usually showing the
dummy activity with a dotted line to distinguish it from real activities.
Overall AOA and AON diagrams accomplish the same thing – they both provide
a means of planning and managing projects and both contain much the same
information. The AON diagram has tended to become more popular as it relates
more closely to what project management software produces as output.
Figure 9.19 Dummy Activity
2
L
Dummy
M
K
1 3
Copyright 2014 Cengage Learning. All Rights Reserved. May not be copied, scanned, or duplicated, in whole or in part. Due to electronic rights, some third party content may be suppressed from the eBook and/or eChapter(s). Editorial review has
deemed that any suppressed content does not materially affect the overall learning experience. Cengage Learning reserves the right to remove additional content at any time if subsequent rights restrictions require it.