
Page 428 -
P. 428
408 CHAPTER 10 INVENTORY MODELS
inventory. Such costs are usually fixed regardless of the actual amount ordered and
are usually expressed as a cost per order placed, E30 per order for example. The
order cost itself is typically made up of staff costs of those involved in raising the
order, receiving and checking the order, paying invoices; postage and phone costs;
transportation and shipping costs.
The third type of cost is known as the stockout cost. This is the cost involved
when customer demand cannot be met because of insufficient inventory. The imme-
diate cost may be that involved in obtaining additional inventory as a matter of
urgency to meet demand. In the medium to long term such costs may also involve
loss of customer goodwill, loss of future sales and loss of future profit – although
these are notoriously difficult to quantify accurately. As a result, stockout costs are
often an educated ‘best guess’.
The prime purpose of effective inventory management is to minimize these costs
by determining the optimum amount of inventory that should be held and ordered
and when inventory should be ordered. In the next section we introduce the most
common model used in inventory management.
10.2 Economic Order Quantity (EOQ) Model
The cost associated with The economic order quantity (EOQ) model is applicable when the demand for an
developing and item shows a constant, or nearly constant, rate and when the entire quantity
maintaining inventory is
larger than many people ordered arrives in inventory at one time. The constant demand rate assumption
think. Models such as means that the same number of units is taken from inventory each period of time
the ones presented in such as five units every day, 25 units every week, 100 units every four-week period
this chapter can be used and so on.
to develop cost-effective
inventory management To illustrate the EOQ model, let us consider the situation faced by the Capetown
decisions. Beverage Company (CBC) in South Africa. CBC is a distributor of soft drink
products. From a main warehouse CBC supplies nearly 1000 small retail stores with
beverage products.
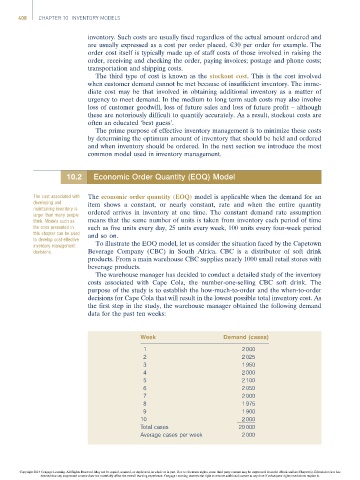
The warehouse manager has decided to conduct a detailed study of the inventory
costs associated with Cape Cola, the number-one-selling CBC soft drink. The
purpose of the study is to establish the how-much-to-order and the when-to-order
decisions for Cape Cola that will result in the lowest possible total inventory cost. As
the first step in the study, the warehouse manager obtained the following demand
data for the past ten weeks:
Week Demand (cases)
1 2 000
2 2 025
3 1 950
4 2 000
5 2 100
6 2 050
7 2 000
8 1 975
9 1 900
10 2 000
Total cases 20 000
Average cases per week 2 000
Copyright 2014 Cengage Learning. All Rights Reserved. May not be copied, scanned, or duplicated, in whole or in part. Due to electronic rights, some third party content may be suppressed from the eBook and/or eChapter(s). Editorial review has
deemed that any suppressed content does not materially affect the overall learning experience. Cengage Learning reserves the right to remove additional content at any time if subsequent rights restrictions require it.