
Page 430 -
P. 430
410 CHAPTER 10 INVENTORY MODELS
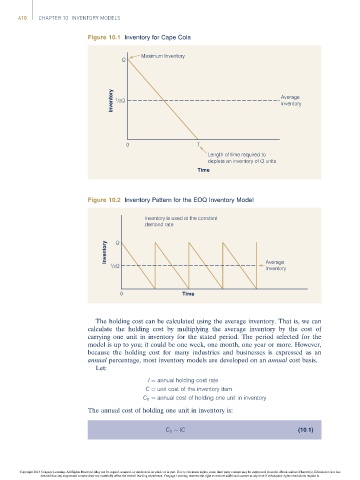
Figure 10.1 Inventory for Cape Cola
Maximum Inventory
Q
Inventory 1 /2Q Average
Inventory
0 T
Length of time required to
deplete an inventory of Q units
Time
Figure 10.2 Inventory Pattern for the EOQ Inventory Model
Inventory is used at the constant
demand rate
Inventory Q
1 /2Q Average
Inventory
0 Time
The holding cost can be calculated using the average inventory. That is, we can
calculate the holding cost by multiplying the average inventory by the cost of
carrying one unit in inventory for the stated period. The period selected for the
model is up to you; it could be one week, one month, one year or more. However,
because the holding cost for many industries and businesses is expressed as an
annual percentage, most inventory models are developed on an annual cost basis.
Let:
I ¼ annual holding cost rate
C ¼ unit cost of the inventory item
C h ¼ annual cost of holding one unit in inventory
The annual cost of holding one unit in inventory is:
C h ¼ IC (10:1)
Copyright 2014 Cengage Learning. All Rights Reserved. May not be copied, scanned, or duplicated, in whole or in part. Due to electronic rights, some third party content may be suppressed from the eBook and/or eChapter(s). Editorial review has
deemed that any suppressed content does not materially affect the overall learning experience. Cengage Learning reserves the right to remove additional content at any time if subsequent rights restrictions require it.