
Page 455 -
P. 455
ORDER-QUANTITY, REORDER POINT MODEL WITH PROBABILISTIC DEMAND 435
D/Q* ¼ 8008/400 ¼ 20 orders per year with an average of approximately 250/20 ¼ 12.5
working days between orders.
The When-to-Order Decision
We now want to establish a when-to-order decision rule or reorder point that will
trigger the ordering process. With a mean lead-time demand of 154 units, you might
first suggest a 154-unit reorder point. However, considering the probability of
demand now becomes extremely important. If 154 is the mean lead-time demand,
and if demand is normally distributed about 154, then the lead-time demand will be
more than 154 units roughly 50 per cent of the time. When the demand during the
one-week lead time exceeds 154 units, Dabco will experience a shortage or stock-
out. Thus, using a reorder point of 154 units, approximately 50 per cent of the time
(ten of the 20 orders a year) Dabco will be short of bulbs before the new supply
The probability of a arrives. This shortage rate would most likely be viewed as unacceptable.
stock-out during any one
inventory cycle is easiest Refer to the lead-time demand distribution shown in Figure 10.11. Given this
to estimate by first distribution, we can now determine how the reorder point r affects the probability of
determining the number a stock-out. Because stock-outs occur whenever the demand during the lead time
of orders that are
expected during the year. exceeds the reorder point, we can find the probability of a stock-out by using the
The inventory manager lead-time demand distribution to compute the probability that demand will exceed r.
can usually state a We could now approach the when-to-order problem by defining a cost per stock-
willingness to allow out and then attempting to include this cost in a total cost equation. Alternatively,
perhaps one, two or
three stock-outs during we can ask management to specify the average number of stock-outs that can be
the year. The allowable tolerated per year. If demand for a product is probabilistic, a manager who will
stock-outs per year never tolerate a stock-out is being somewhat unrealistic because attempting to avoid
divided by the number of stock-outs completely will require high reorder points, high inventory and an asso-
orders per year will
provide the desired ciated high holding cost.
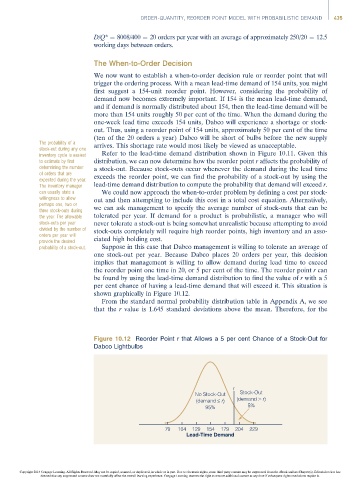
probability of a stock-out. Suppose in this case that Dabco management is willing to tolerate an average of
one stock-out per year. Because Dabco places 20 orders per year, this decision
implies that management is willing to allow demand during lead time to exceed
the reorder point one time in 20, or 5 per cent of the time. The reorder point r can
be found by using the lead-time demand distribution to find the value of r with a 5
per cent chance of having a lead-time demand that will exceed it. This situation is
shown graphically in Figure 10.12.
From the standard normal probability distribution table in Appendix A, we see
that the r value is 1.645 standard deviations above the mean. Therefore, for the
Figure 10.12 Reorder Point r that Allows a 5 per cent Chance of a Stock-Out for
Dabco Lightbulbs
r
No Stock-Out Stock-Out
(demand r) (demand > r)
95% 5%
79 104 129 154 179 204 229
Lead-Time Demand
Copyright 2014 Cengage Learning. All Rights Reserved. May not be copied, scanned, or duplicated, in whole or in part. Due to electronic rights, some third party content may be suppressed from the eBook and/or eChapter(s). Editorial review has
deemed that any suppressed content does not materially affect the overall learning experience. Cengage Learning reserves the right to remove additional content at any time if subsequent rights restrictions require it.