Page 562 -
P. 562

542   CHAPTER 13 DECISION ANALYSIS


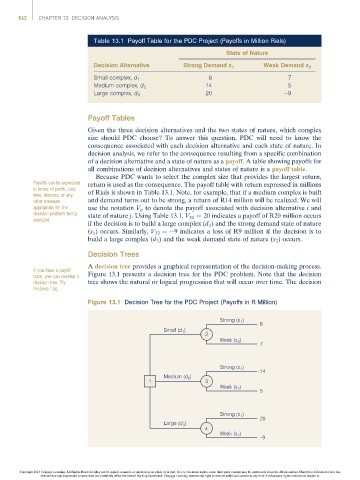
                                      Table 13.1 Payoff Table for the PDC Project (Payoffs in Million Rials)
                                                                               State of Nature
                                      Decision Alternative        Strong Demand s 1        Weak Demand s 2

                                                                          8                       7
                                      Small complex, d 1
                                                                         14                       5
                                      Medium complex, d 2
                                                                         20                       9
                                      Large complex, d 3
                                     Payoff Tables

                                     Given the three decision alternatives and the two states of nature, which complex
                                     size should PDC choose? To answer this question, PDC will need to know the
                                     consequence associated with each decision alternative and each state of nature. In
                                     decision analysis, we refer to the consequence resulting from a specific combination
                                     of a decision alternative and a state of nature as a payoff. A table showing payoffs for
                                     all combinations of decision alternatives and states of nature is a payoff table.
                                       Because PDC wants to select the complex size that provides the largest return,
                    Payoffs can be expressed  return is used as the consequence. The payoff table with return expressed in millions
                    in terms of profit, cost,
                    time, distance or any  of Rials is shown in Table 13.1. Note, for example, that if a medium complex is built
                    other measure    and demand turns out to be strong, a return of R14 million will be realized. We will
                    appropriate for the  use the notation V ij to denote the payoff associated with decision alternative i and
                    decision problem being  state of nature j. Using Table 13.1, V 31 ¼ 20 indicates a payoff of R20 million occurs
                    analyzed.
                                     if the decision is to build a large complex (d 3 ) and the strong demand state of nature
                                     (s 1 ) occurs. Similarly, V 32 ¼ 9 indicates a loss of R9 million if the decision is to
                                     build a large complex (d 3 ) and the weak demand state of nature (s 2 ) occurs.

                                     Decision Trees
                                     A decision tree provides a graphical representation of the decision-making process.
                    If you have a payoff
                    table, you can develop a  Figure 13.1 presents a decision tree for the PDC problem. Note that the decision
                    decision tree. Try  tree shows the natural or logical progression that will occur over time. The decision
                    Problem 1(a).

                                     Figure 13.1 Decision Tree for the PDC Project (Payoffs in R Million)


                                                                             Strong (s 1 )
                                                                                         8
                                                            Small (d )
                                                                 1
                                                                         2
                                                                                   )
                                                                             Weak (s 2
                                                                                         7
                                                                             Strong (s 1 )
                                                                                         14
                                                            Medium (d )
                                                                   2
                                                       1                 3
                                                                             Weak (s )
                                                                                   2
                                                                                         5
                                                                             Strong (s )
                                                                                   1
                                                            Large (d )                   20
                                                                  3
                                                                        4
                                                                             Weak (s )   –9
                                                                                   2


                Copyright 2014 Cengage Learning. All Rights Reserved. May not be copied, scanned, or duplicated, in whole or in part. Due to electronic rights, some third party content may be suppressed from the eBook and/or eChapter(s). Editorial review has
                      deemed that any suppressed content does not materially affect the overall learning experience. Cengage Learning reserves the right to remove additional content at any time if subsequent rights restrictions require it.
   557   558   559   560   561   562   563   564   565   566   567