
Page 611 -
P. 611
DECISION ANALYSIS WITH TREEPLAN 591
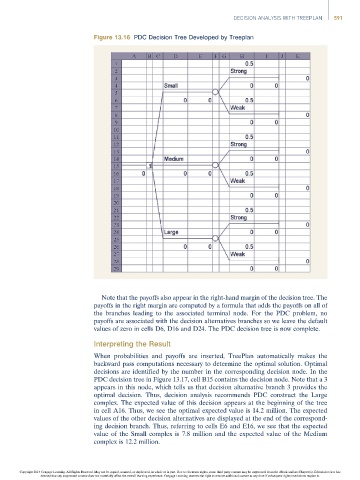
Figure 13.16 PDC Decision Tree Developed by Treeplan
Note that the payoffs also appear in the right-hand margin of the decision tree. The
payoffs in the right margin are computed by a formula that adds the payoffs on all of
the branches leading to the associated terminal node. For the PDC problem, no
payoffs are associated with the decision alternatives branches so we leave the default
values of zero in cells D6, D16 and D24. The PDC decision tree is now complete.
Interpreting the Result
When probabilities and payoffs are inserted, TreePlan automatically makes the
backward pass computations necessary to determine the optimal solution. Optimal
decisions are identified by the number in the corresponding decision node. In the
PDC decision tree in Figure 13.17, cell B15 contains the decision node. Note that a 3
appears in this node, which tells us that decision alternative branch 3 provides the
optimal decision. Thus, decision analysis recommends PDC construct the Large
complex. The expected value of this decision appears at the beginning of the tree
in cell A16. Thus, we see the optimal expected value is 14.2 million. The expected
values of the other decision alternatives are displayed at the end of the correspond-
ing decision branch. Thus, referring to cells E6 and E16, we see that the expected
value of the Small complex is 7.8 million and the expected value of the Medium
complex is 12.2 million.
Copyright 2014 Cengage Learning. All Rights Reserved. May not be copied, scanned, or duplicated, in whole or in part. Due to electronic rights, some third party content may be suppressed from the eBook and/or eChapter(s). Editorial review has
deemed that any suppressed content does not materially affect the overall learning experience. Cengage Learning reserves the right to remove additional content at any time if subsequent rights restrictions require it.