
Page 65 -
P. 65
GRAPHICAL SOLUTION PROCEDURE 45
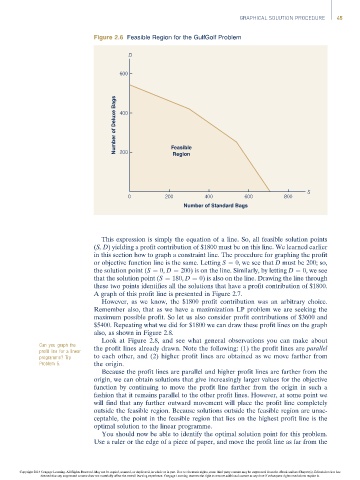
Figure 2.6 Feasible Region for the GulfGolf Problem
D
600
Number of Deluxe Bags 400 Feasible
200
Region
S
0 200 400 600 800
Number of Standard Bags
This expression is simply the equation of a line. So, all feasible solution points
(S, D) yielding a profit contribution of $1800 must be on this line. We learned earlier
in this section how to graph a constraint line. The procedure for graphing the profit
or objective function line is the same. Letting S ¼ 0, we see that D must be 200; so,
the solution point (S ¼ 0, D ¼ 200) is on the line. Similarly, by letting D ¼ 0, we see
that the solution point (S ¼ 180, D ¼ 0) is also on the line. Drawing the line through
these two points identifies all the solutions that have a profit contribution of $1800.
A graph of this profit line is presented in Figure 2.7.
However, as we know, the $1800 profit contribution was an arbitrary choice.
Remember also, that as we have a maximization LP problem we are seeking the
maximum possible profit. So let us also consider profit contributions of $3600 and
$5400. Repeating what we did for $1800 we can draw these profit lines on the graph
also, as shown in Figure 2.8.
Look at Figure 2.8, and see what general observations you can make about
Canyou graphthe
profit line for a linear the profit lines already drawn. Note the following: (1) the profit lines are parallel
programme? Try to each other, and (2) higher profit lines are obtained as we move farther from
Problem 5. the origin.
Because the profit lines are parallel and higher profit lines are farther from the
origin, we can obtain solutions that give increasingly larger values for the objective
function by continuing to move the profit line farther from the origin in such a
fashion that it remains parallel to the other profit lines. However, at some point we
will find that any further outward movement will place the profit line completely
outside the feasible region. Because solutions outside the feasible region are unac-
ceptable, the point in the feasible region that lies on the highest profit line is the
optimal solution to the linear programme.
You should now be able to identify the optimal solution point for this problem.
Use a ruler or the edge of a piece of paper, and move the profit line as far from the
Copyright 2014 Cengage Learning. All Rights Reserved. May not be copied, scanned, or duplicated, in whole or in part. Due to electronic rights, some third party content may be suppressed from the eBook and/or eChapter(s). Editorial review has
deemed that any suppressed content does not materially affect the overall learning experience. Cengage Learning reserves the right to remove additional content at any time if subsequent rights restrictions require it.