
Page 23 - Analog and Digital Filter Design
P. 23
20 Analog and Digital Filter Design
The time domain is where an event, such as a change in amplitude, is measured
over time. All alternating current (AC) signals vary in amplitude over a certain
time period. Some signals are periodic, which means that the same pattern of
variation is repeated again and again. Signals are measured and displayed in
time domain by an oscilloscope. A line is drawn horizontally across the screen
at a steady rate, and the signal amplitude is used to change the vertical position
of the line. An increasingly positive going signal forces the line to rise toward
the top of the screen, and an increasingly negative going signal forces the line
toward the bottom of the screen.
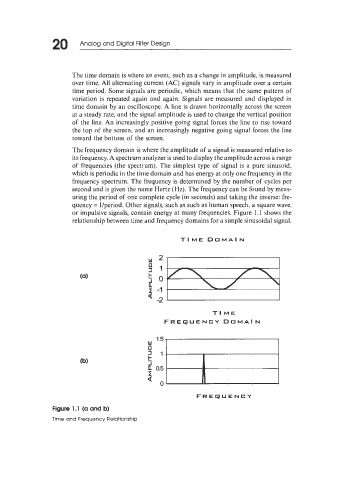
The frequency domain is where the amplitude of a signal is measured relative to
its frequency. A spectrum analyzer is used to display the amplitude across a range
of frequencies (the spectrum). The simplest type of signal is a pure sinusoid,
which is periodic in the time domain and has energy at only one frequency in the
frequency spectrum. The frequency is determined by the number of cycles per
second and is given the name Hertz (Hz). The frequency can be found by meas-
uring the period of one complete cycle (in seconds) and taking the inverse: fre-
quency = llperiod. Other signals, such as such as human speech, a square wave,
or impulsive signals, contain energy at many frequencies. Figure 1.1 shows the
relationship between time and frequency domains for a simple sinusoidal signal.
TIME DOMAIN
w 21
TI ME
FREQUENCY DOMAIN
1.5 I
w 1
FREQUENCY
Figure 1.1 (a and b)
Time and Frequency Relationship