
Page 415 - Analog and Digital Filter Design
P. 415
4 1 2 Analog and Digital Filter Design
scaling factor of 1.75 must be used. Rather than scale w before the phase is cal-
culated, calculate the phase for a value of w, then scale the frequency. Essen-
tially, the phase shifts indicated above occur at a lower frequency in the case of
the normalized 3 dB cutoff response. A 0.249999 rad phase shift will occur at
w = 0.2511.75 = 0.143rads.
The reader may like to work out the amplitude and phase of higher-order Bessel
responses and for this will need to work out Bessel polynomials. Bessel polyno-
mials for orders up to three have already been given, in this section and 4th, 5th
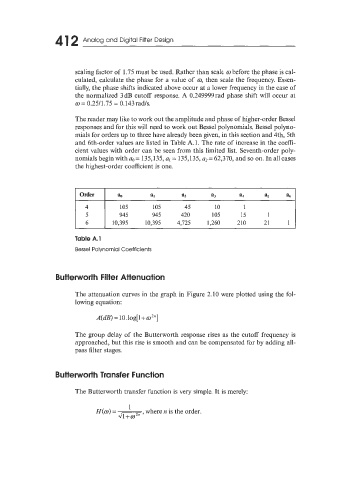
and 6th-order values are listed in Table A.l. The rate of increase in the coeffi-
cient values with order can be seen from this limited list. Seventh-order poly-
nomials begin withao= 135,135, a, = 135,135, a?= 62,370, and so on. In allcases
the highest-order coefficient is one.
4 105 105 45 10 1
5 945 945 420 105 15 1
6 10,395 10,395 4,725 1,260 210 21 1
Table A.l
Bessel Polynomial Coefficients
Butterworth Filter Attenuation
The attenuation curves in the graph in Figure 2.10 were plotted using the fol-
lowing equation:
A(&) = 10.log[l+o'"]
The group delay of the Butterworth response rises as the cutoff frequency is
approached, but this rise is smooth and can be compensated for by adding all-
pass filter stages.
Buiterworth Transfer Function
The Butterworth transfer function is very simple. It is merely:
1
H(~o) where n is the order.
=
GiF'