
Page 52 - Analog and Digital Filter Design
P. 52
Time and Frequency Response 49
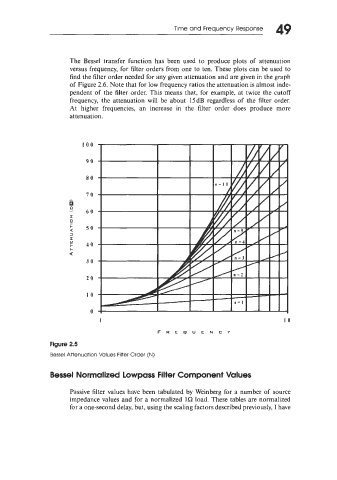
The Bessel transfer function has been used to produce plots of attenuation
versus frequency, for filter orders from one to ten. These plots can be used to
find the filter order needed for any given attenuation and are given in the graph
of Figure 2.6. Note that for low frequency ratios the attenuation is almost inde-
pendent of the filter order. This means that, for example, at twice the cutoff
frequency, the attenuation will be about 15dB regardless of the filter order.
At higher frequencies, an increase in the filter order does produce more
attenuation.
IO0
90
80
- 70
0
I 60
z
!
a 50
3
z
W
I- 40
I-
a
30
20
IO
".
I 10
F R E Q U E N C Y
Figure 2.5
Bessel Attenuation Values Filter Order (N)
Bessel Normalized Lowpass Filter Component Values
Passive filter values have been tabulated by Weinberg for a number of source
impedance values and for a normalized la load. These tables are normalized
for a one-second delay, but, using the scaling factors described previously, I have