
Page 45 - Analysis, Synthesis and Design of Chemical Processes, Third Edition
P. 45
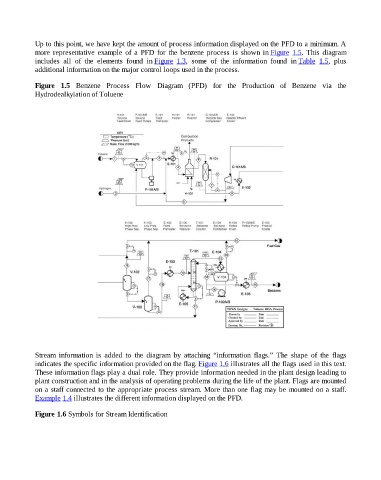
Up to this point, we have kept the amount of process information displayed on the PFD to a minimum. A
                    more  representative  example  of  a  PFD  for  the  benzene  process  is  shown  in Figure  1.5.  This  diagram
                    includes  all  of  the  elements  found  in Figure  1.3,  some  of  the  information  found  in Table  1.5,  plus
                    additional information on the major control loops used in the process.


                    Figure  1.5  Benzene  Process  Flow  Diagram  (PFD)  for  the  Production  of  Benzene  via  the
                    Hydrodealkylation of Toluene


                    Stream  information  is  added  to  the  diagram  by  attaching  “information  flags.”  The  shape  of  the  flags
                    indicates the specific information provided on the flag. Figure 1.6 illustrates all the flags used in this text.
                    These information flags play a dual role. They provide information needed in the plant design leading to
                    plant construction and in the analysis of operating problems during the life of the plant. Flags are mounted
                    on a staff connected to the appropriate process stream. More than one flag may be mounted on a staff.
                    Example 1.4 illustrates the different information displayed on the PFD.


                    Figure 1.6 Symbols for Stream Identification