Page 30 - Analytical Electrochemistry 2d Ed - Jospeh Wang
P. 30

1-2  FARADAIC PROCESSES                                          15


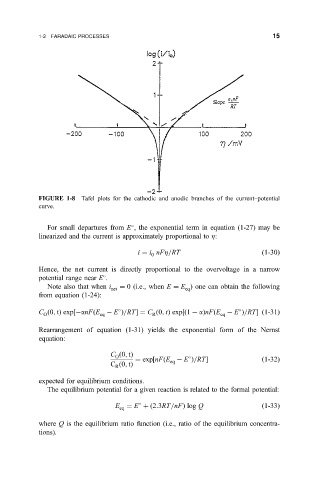
            FIGURE 1-8  Tafel plots for the cathodic and anodic branches of the current±potential
            curve.


              For small departures from E , the exponential term in equation (1-27) may be

            linearized and the current is approximately proportional to Z:
                                       i ˆ i nFZ=RT                       …1-30†
                                           0
            Hence, the net current is directly proportional to the overvoltage in a narrow
            potential range near E .

              Note also that when i net  ˆ 0(i.e., when E ˆ E ) one can obtain the following
                                                    eq
            from equation (1-24):

            C …0; t† exp‰ anF…E   E †=RTŠˆ C …0; t† exp‰…1   a†nF…E   E †=RTŠ…1-31†
                                                              eq
                                           R
             O
                             eq
            Rearrangement of equation (1-31) yields the exponential form of the Nernst
            equation:
                                C …0; t†
                                 O

                                       ˆ exp‰nF…E   E †=RTŠ               …1-32†
                                                eq
                                C …0; t†
                                 R
            expected for equilibrium conditions.
              The equilibrium potential for a given reaction is related to the formal potential:
                                 E ˆ E ‡…2:3RT=nF† log Q                  …1-33†

                                  eq
            where Q is the equilibrium ratio function (i.e., ratio of the equilibrium concentra-
            tions).
   25   26   27   28   29   30   31   32   33   34   35