Page 129 - Antennas for Base Stations in Wireless Communications
P. 129

102     Chapter Three

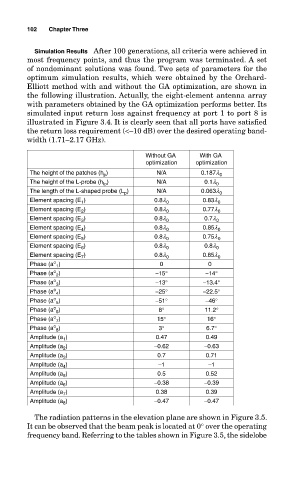
                    Simulation Results  After 100 generations, all criteria were achieved in
                  most frequency points, and thus the program was terminated. A set
                  of nondominant solutions was found. Two sets of parameters for the
                  optimum  simulation  results,  which  were  obtained  by  the  Orchard-
                  Elliott method with and without the GA optimization, are shown in
                  the following illustration. Actually, the eight-element antenna array
                  with parameters obtained by the GA optimization performs better. Its
                  simulated input return loss against frequency at port 1 to port 8 is
                  illustrated in Figure 3.4. It is clearly seen that all ports have satisfied
                  the return loss requirement (<–10 dB) over the desired operating band-
                  width (1.71–2.17 GHz).

                                                  Without GA     With GA
                                                  optimization  optimization
                   The height of the patches (h )    N/A         0.187l 0
                                       p
                   The height of the L-probe (h lp )   N/A        0.1l 0
                   The length of the L-shaped probe (L )   N/A   0.063l 0
                                             p
                   Element spacing (E )              0.8l 0       0.83l 0
                                 1
                   Element spacing (E )              0.8l 0       0.77l 0
                                 2
                   Element spacing (E )              0.8l 0       0.7l 0
                                 3
                   Element spacing (E )              0.8l 0       0.85l 0
                                 4
                   Element spacing (E )              0.8l 0       0.75l 0
                                 5
                   Element spacing (E )              0.8l 0       0.8l 0
                                 6
                   Element spacing (E )              0.8l 0       0.85l 0
                                 7
                          o
                   Phase (a )                         0            0
                          1
                          o
                   Phase (a )                        −15°          −14°
                          2
                          o
                   Phase (a )                        −13°         −13.4°
                          3
                          o
                   Phase (a )                        −25°         −22.5°
                          4
                          o
                   Phase (a )                        −51°          −46°
                          5
                          o
                   Phase (a )                         8°          11.2°
                          6
                          o
                   Phase (a )                         15°          16°
                          7
                          o
                   Phase (a )                         3°           6.7°
                          8
                   Amplitude (a )                    0.47          0.49
                            1
                   Amplitude (a )                    −0.62        −0.63
                            2
                   Amplitude (a )                     0.7          0.71
                            3
                   Amplitude (a )                     −1           −1
                            4
                   Amplitude (a )                     0.5          0.52
                            5
                   Amplitude (a )                    −0.38        −0.39
                            6
                   Amplitude (a )                    0.38          0.39
                            7
                   Amplitude (a )                    −0.47        −0.47
                            8
                    The radiation patterns in the elevation plane are shown in Figure 3.5.
                  It can be observed that the beam peak is located at 0° over the operating
                  frequency band. Referring to the tables shown in Figure 3.5, the sidelobe
   124   125   126   127   128   129   130   131   132   133   134