Page 146 - Antennas for Base Stations in Wireless Communications
P. 146

Antennas for Mobile Communications: CDMA, GSM, and WCDMA        119


                                        R


                                                        R t


                                                                      Y

                          Disc
                                                                          X (φ = 0°)
                                                                    Z
                             Circular patch           Shorting
                                              W 1    trapezoidal
                                                        plate
                                              d                t s
                                                                          Z
                         t p
                                Disc                    t d                   X
                                                                   H   −Y
                                Wire                    h
                                                                              GT

                                                       N-type
                                              W 2     connector  Ground plane
                               GR                r
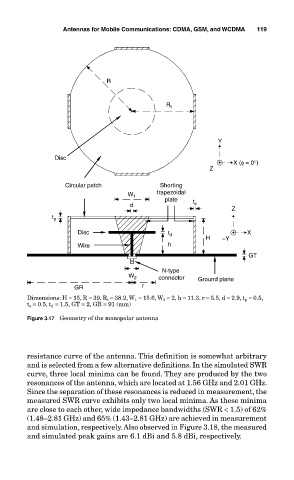
                  Dimensions: H = 15, R = 39, R t  = 38.2, W 1  = 15.6, W 2  = 2, h = 11.3, r = 5.5, d = 2.9, t p  = 0.5,
                  t s  = 0.5, t d  = 1.5, GT = 2, GR = 91 (mm)
                  Figure 3.17  Geometry of the monopolar antenna


                  resistance curve of the antenna. This definition is somewhat arbitrary
                  and is selected from a few alternative definitions. In the simulated SWR
                  curve, three local minima can be found. They are produced by the two
                  resonances of the antenna, which are located at 1.56 GHz and 2.01 GHz.
                  Since the separation of these resonances is reduced in measurement, the
                  measured SWR curve exhibits only two local minima. As these minima
                  are close to each other, wide impedance bandwidths (SWR < 1.5) of 62%
                  (1.48–2.81 GHz) and 65% (1.43–2.81 GHz) are achieved in measurement
                  and simulation, respectively. Also observed in Figure 3.18, the measured
                  and simulated peak gains are 6.1 dBi and 5.8 dBi, respectively.
   141   142   143   144   145   146   147   148   149   150   151