
Page 247 - Applied Process Design For Chemical And Petrochemical Plants Volume III
P. 247
66131_Ludwig_CH10G 5/30/2001 4:38 PM Page 210
210 Applied Process Design for Chemical and Petrochemical Plants
Table 10-37 If pressure drop is too high, reselect and redesign unit,
Typical Cast Iron Section, Type B, Figure 10-127 making parallel units to reduce flow rate (and
coefficient h io ), or select a larger pipe, reducing mass
Metal Cubic Internal External Eq. rate G, and hence h io . Recalculate the pressure drop.
Thickness, Contents, Wt./ Surf., Surf., Diam.,
in. gal Section ft 2 ft 2 in.
Impregnated graphite coolers, Figure 10-131 and Table 10-
1 2.7 130 11.0 10.0 1.57 38, are used in acids and other corrosive liquids. The selection
/ 4
3 2.7 180 11.0 10.8 1.57 charts of Figures 10-132, 10-133, and 10-134 can be used to
/ 8
1 2.7 210 11.0 11.5 1.57 determine expected transfer coefficients and total external
/ 2
cooling surface for a typical style of unit. Although these
Note: Other types of sections are available to accomplish the same type
of cooling. charts are specific to the manufacturer’s wall thicknesses and
the thermal conductivity of the material, they are nevertheless
Used by permission: Cat. HT-23, National U.S. Radiator Corp. Existence
of company not confirmed (1998). convenient and generally acceptable. Exact selections should
be obtained from the manufacturers by giving them the flow
data and performance requirements. Pressure drops can be
estimated from Figures 10-135 and 10-136.
Pressure Drop for Plain Tube Exchangers
A. Tube Side
Pressure loss through the inside of the tubes during heat-
ing or cooling in heat exchangers is given for liquids and
gases by 70
2
2
f G t Ln f G t Ln
p t , psi (10-207)
10
2g D i t 5.221102 D i s t
2
2
The friction factor, f, ft / in. , must be obtained from Fig-
ure 10-138. Because it is not a dimensional factor, the p t
relations take this into account.
0.14
t a b for R e 7 2,100 (10-208)
w
0.25
t a b for R e 6 2,100 (10-209)
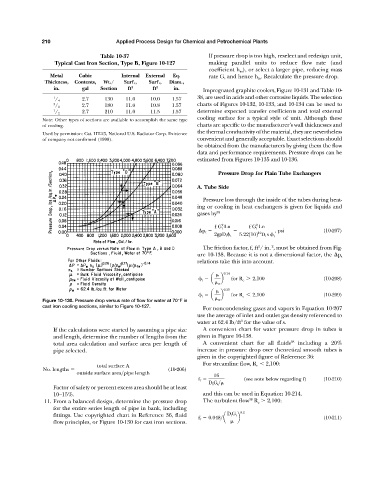
Figure 10-130. Pressure drop versus rate of flow for water at 70°F in
w
cast iron cooling sections, similar to Figure 10-127.
For noncondensing gases and vapors in Equation 10-207
use the average of inlet and outlet gas density referenced to
3
water at 62.4 lb/ft for the value of s.
If the calculations were started by assuming a pipe size A convenient chart for water pressure drop in tubes is
and length, determine the number of lengths from the given in Figure 10-138.
total area calculation and surface area per length of A convenient chart for all fluids 38 including a 20%
pipe selected. increase in pressure drop over theoretical smooth tubes is
given in the copyrighted figure of Reference 36:
For streamline flow, R e 2,100:
total surface A
No. lengths (10-206)
outside surface area>pipe length 16
f f (see note below regarding f) (10-210)
D i G t >
Factor of safety or percent excess area should be at least
10–15%. and this can be used in Equation 10-214.
38
11. From a balanced design, determine the pressure drop The turbulent flow R e 2,100:
for the entire series length of pipe in bank, including
0.2
fittings. Use copyrighted chart in Reference 36, fluid D i G t
f f 0.048>a b (10-211)
flow principles, or Figure 10-130 for cast iron sections.