
Page 258 - Applied Process Design For Chemical And Petrochemical Plants Volume III
P. 258
66131_Ludwig_CH10G 5/30/2001 4:38 PM Page 220
220 Applied Process Design for Chemical and Petrochemical Plants
Finned Surface Heat Transfer Pressure drop across finned tubes: 166
Rohsenow and Hartnett 166 recommend the Briggs and 1G m D r 2 0.316 1P t 2 0.927 1P t 2 0.515 1G m n2
2
Young 205 convection film coefficient relation for externally p 18.93 (10-234)
1
2 1D r 2 1P l 2 1g c 2
finned tubes.
The equations provide reasonable estimates per Rohse-
1D r G max 2 0.681 1c p
2 1>3 1s2 0.2 1s2 0.113 now, 166 who suggests using with caution, only when perfor-
h fo D r
0.134 (10-233) 204
k 1
2 1k2 l t mance on the system is not available. Ganapathy offers
simplified equations and nomographs to solve these rela-
where h fo mean outside finned surface heat transfer (usually tions.
2
gas) coefficient, Btu/(hr) (°F)(ft external) Table 10-40 provides a suggested range of overall heat
D r root diameter of tube (external), ft transfer coefficients, U o , for actual finned heat exchangers.
d n root diameter of tube, external, in.
2
k thermal conductivity of gas, Btu/(hr) (ft ) (°F/ft) Economics of Finned Tubes
G max gas mass velocity at minimum cross-section, through
2
a row or tubes normal to flow, lb/(hr) (ft ) Figure 10-143 is useful in roughly predicting the relative
G m mass velocity at minimum cross-section through a economic picture for adapting low finned tubes to the heat
2
row of tubes normal to flow, lb/(hr) (ft ) or cooling of oil on the shell side of conventional shell and
8
g c acceleration of gravity, 4.18 10 , ft/(hr) (hr)
tube units. This is not a design chart.
n number of rows in direction of flow 126
Figures 10-144 and 10-145 also indicate the relative
gas/vapor viscosity at bulk temperature, lb/(hr) (ft)
advantage regions for the finned unit, for the average water-
c p specific heat, Btu/(lb) (°F)
cooled exchanger of 150 psi design. For example, for a plain
s distance between adjacent fins, in.
l fin height, in. tube with an overall fouling coefficient of 125, inside fouling
t fin thickness, in. of 0.0015, and outside fouling of 0.002, the finned tube unit
P t transverse pitch between adjacent tubes in same row, would be more economical. The fouling lines, r, on the
in. charts are the limit border lines of the particular economics,
P l longitudinal pitch between adjacent tubes in differ- which assumed equal costs for the finned and bare tube
ent rows measured on the diagonal, in. exchangers. Again, these are not to be used for specific
P static pressure drop, lb/ft 2 exchanger design, but merely in deciding the region of
density of gas, lb/ft 3
applicability.
f mean friction factor, this is the “small” or fanning
2
friction factor. Note: f P g c /(n G m )
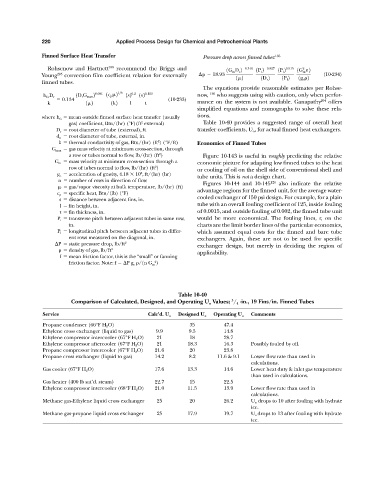
Table 10-40
3
Comparison of Calculated, Designed, and Operating U o Values; / 4 -in., 19 Fins/in. Finned Tubes
Service Calc’d. U o Designed U o Operating U o Comments
Propane condenser (66°F H 2 O) 35 47.4
Ethylene cross exchanger (liquid to gas) 9.9 9.5 14.8
Ethylene compressor intercooler (67°F H 2 O) 21 18 28.7
Ethylene compressor aftercooler (67°F H 2 O) 21 18.3 16.3 Possibly fouled by oil.
Propane compressor intercooler (67°F H 2 O) 21.6 20 23.8
Propane cross exchanger (liquid to gas) 14.2 8.2 11.6 & 9.1 Lower flow rate than used in
calculations.
Gas cooler (67°F H 2 O) 17.6 13.3 14.6 Lower heat duty & inlet gas temperature
than used in calculations.
Gas heater (400 lb sat’d. steam) 22.7 15 22.5
Ethylene compressor intercooler (68°F H 2 O) 21.0 11.5 13.9 Lower flow rate than used in
calculations.
Methane gas-Ethylene liquid cross exchanger 25 20 26.2 U o drops to 10 after fouling with hydrate
ice.
Methane gas-propane liquid cross exchanger 25 17.9 19.7 U o drops to 13 after fouling with hydrate
ice.