
Page 58 - Applied Numerical Methods Using MATLAB
P. 58
PROBLEMS 47
as he wants until he presses <Enter> and save the whole data in the
form of an N × 2matrixintoan ASCII data file(***.dat) named by
the user. If you have no idea how to compose such a program, you
can permutate the statements in the box below to make your program.
Store the program in the file named “nm1p01a.m” and run it to save
the following data into the data file named “hw.dat”:
5.5162
6.1185
5.7170
6.5195
6.2191
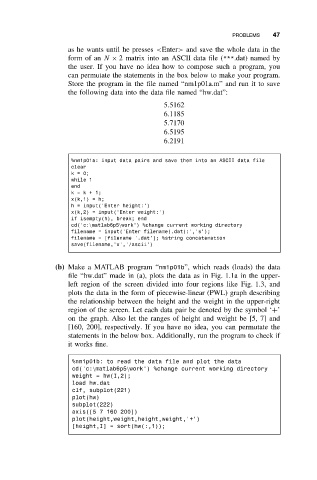
%nm1p01a: input data pairs and save them into an ASCII data file
clear
k=0;
while 1
end
k=k+1;
x(k,1) = h;
h = input(’Enter height:’)
x(k,2) = input(’Enter weight:’)
if isempty(h), break; end
cd(’c:\matlab6p5\work’) %change current working directory
filename = input(’Enter filename(.dat):’,’s’);
filename = [filename ’.dat’]; %string concatenation
save(filename,’x’,’/ascii’)
(b) Make a MATLAB program “nm1p01b”, which reads (loads) the data
file “hw.dat” made in (a), plots the data as in Fig. 1.1a in the upper-
left region of the screen divided into four regions like Fig. 1.3, and
plots the data in the form of piecewise-linear (PWL) graph describing
the relationship between the height and the weight in the upper-right
region of the screen. Let each data pair be denoted by the symbol ‘+’
on the graph. Also let the ranges of height and weight be [5, 7] and
[160, 200], respectively. If you have no idea, you can permutate the
statements in the below box. Additionally, run the program to check if
it works fine.
%nm1p01b: to read the data file and plot the data
cd(’c:\matlab6p5\work’) %change current working directory
weight = hw(I,2);
load hw.dat
clf, subplot(221)
plot(hw)
subplot(222)
axis([5 7 160 200])
plot(height,weight,height,weight,’+’)
[height,I] = sort(hw(:,1));