
Page 59 - Applied Numerical Methods Using MATLAB
P. 59
48 MATLAB USAGE AND COMPUTATIONAL ERRORS
1.2 Text Printout of Alphanumeric Data
Make a routine max_array(A), which uses the max() command to find one
of the maximum elements of a matrix A given as its input argument and
uses the fprintf() command to print it onto the screen together with its
row/column indices in the following format.
’\n Max(A) is A(%2d,%2d) = %5.2f\n’,row_index,col_index,maxA
Additionally, try it to have the maximum element of an arbitrary matrix
(generated by the following two consecutive commands) printed in this
format onto the screen.
>>rand(’state’,sum(100*clock)), rand(3)
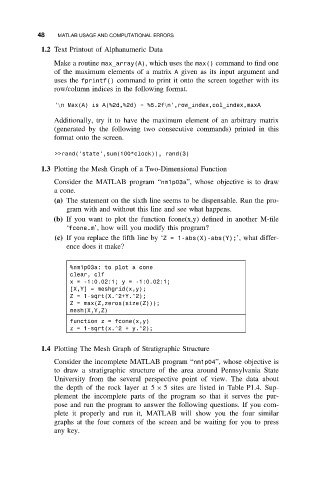
1.3 Plotting the Mesh Graph of a Two-Dimensional Function
Consider the MATLAB program “nm1p03a”, whose objective is to draw
a cone.
(a) The statement on the sixth line seems to be dispensable. Run the pro-
gram with and without this line and see what happens.
(b) If you want to plot the function fcone(x,y) defined in another M-file
‘fcone.m’, how will you modify this program?
(c) If you replace the fifth line by ‘Z = 1-abs(X)-abs(Y);’, what differ-
ence does it make?
%nm1p03a: to plot a cone
clear, clf
x = -1:0.02:1; y = -1:0.02:1;
[X,Y] = meshgrid(x,y);
Z = 1-sqrt(X.^2+Y.^2);
Z = max(Z,zeros(size(Z)));
mesh(X,Y,Z)
function z = fcone(x,y)
z = 1-sqrt(x.^2 + y.^2);
1.4 Plotting The Mesh Graph of Stratigraphic Structure
Consider the incomplete MATLAB program “nm1p04”, whose objective is
to draw a stratigraphic structure of the area around Pennsylvania State
University from the several perspective point of view. The data about
the depth of the rock layer at 5 × 5 sites are listed in Table P1.4. Sup-
plement the incomplete parts of the program so that it serves the pur-
pose and run the program to answer the following questions. If you com-
plete it properly and run it, MATLAB will show you the four similar
graphs at the four corners of the screen and be waiting for you to press
any key.