
Page 23 - Applied Petroleum Geomechanics
P. 23
Stresses and strains 13
(A) (B)
σ σ
Elas c
Elas c perfectly-plas c
ε ε
(C) (D)
σ σ
Peak strength
Residual strength
Elasto-so ening
Elasto-bri le
ε ε
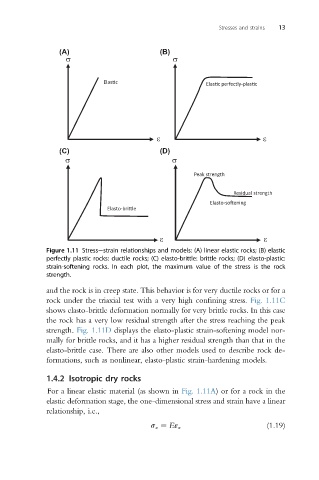
Figure 1.11 Stressestrain relationships and models: (A) linear elastic rocks; (B) elastic
perfectly plastic rocks: ductile rocks; (C) elasto-brittle: brittle rocks; (D) elasto-plastic:
strain-softening rocks. In each plot, the maximum value of the stress is the rock
strength.
and the rock is in creep state. This behavior is for very ductile rocks or for a
rock under the triaxial test with a very high confining stress. Fig. 1.11C
shows elasto-brittle deformation normally for very brittle rocks. In this case
the rock has a very low residual strength after the stress reaching the peak
strength. Fig. 1.11D displays the elasto-plastic strain-softening model nor-
mally for brittle rocks, and it has a higher residual strength than that in the
elasto-brittle case. There are also other models used to describe rock de-
formations, such as nonlinear, elasto-plastic strain-hardening models.
1.4.2 Isotropic dry rocks
For a linear elastic material (as shown in Fig. 1.11A) or for a rock in the
elastic deformation stage, the one-dimensional stress and strain have a linear
relationship, i.e.,
s x ¼ Eε x (1.19)