
Page 29 - Applied Process Design For Chemical And Petrochemical Plants Volume II
P. 29
18 Applied Process Design for Chemical and Petrochemical Plants
and at a pressure of 75 psia, calculate the amounts and
compositions of the gas and liquid phases.
Referring to Example &2:
ComDosition Mol Fraction
C2H6 0.15
CsH8 0.15
n44HlO 0.30
i-C4H10 0.25
n-CjH12 0.15
1.00
Must Catculate Bubbb Point at 75 psia:
Composition MolFrac. K@jO"F Y=Kx K.@ 40°F v-Kx
c2H6 0.13 5.0 0.75 4.5 0.673 0.7 0.8 0.9 1.0 1.1 1.2 1.3 1.4 1.5
CSHS 0.15 1.2 0.18 1.07 0.1603
nW10 0.30 0.325 0.0975 0.28 0.084 cALcuwm/K
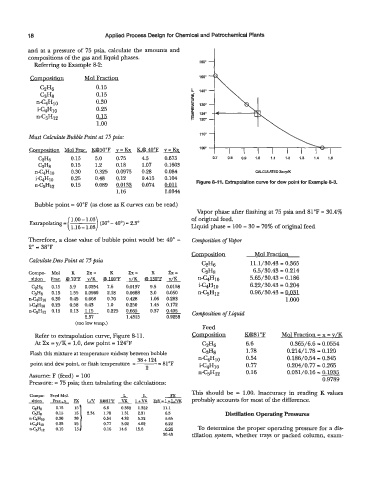
iW10 0.25 0.48 0.12 0.415 0.104 Figure 8-11. Extrapolation curve for dew point for Example 8-3.
nC5H12 0.15 0.089 0.0133 0.074 0.011
1.16 1.0344
Bubble point = 40°F (as close as K curves can be read) Vapor phase after flashing at 75 psia and 81°F = 30.4%
0 of original feed.
1.00 - 1.03
Extrapolating = 1.16- (50" - 40") = 2.3" Liquid phase = 100 - 30 = 70% of original feed
1.03
Therefore, a close value of bubble point would be: 40" - Composition of Vapor
2" = 38°F
Composition Mol Fraction
Calculate Dew Point at 75 psia
C2H6 11.1/30.43 = 0.365
Compe Mol K Px= K EX= K Zx = C3H8 6.5/30.43 = 0.214
v/K
sition F-. @a 100°F v/K @ 130°F v/K n-C&10 5.65/30.43 = 0.186
@I
C& 0.15 5.9 0.0254 7.6 0.0197 9.5 0.0158 i-10 6.22/30.43 = 0.204
c3H8 0.15 1.55 0.0969 2.18 0.0688 3.0 0.050 n-C5H12 0.96/30.43 = 0.031
n-10 0.30 0.45 0.668 0.70 0.428 1.06 0.283 1 .ooo
i-10 0.25 0.58 0.43 1.0 0.250 1.48 0.172
0.405
n-C5H12 0.15 0.13 1.15 0.225 0.66j 0.37 -
Com@tirm of Liquid
2.37 1.4318 0.9258
(too low temp.)
Feed
Refer to extrapolation curve, Figure 8-1 1. Composition K@81"F Mol Fraction = x = v/K
At Zx = y/K = 1.0, dew point = 124°F C2H6 6.6 0.365/6.6 = 0.0554
Flash this mixture at temperature midway between bubble C3H8 1.78 0.214/1.78 = 0.120
38 + 124
point and dew point, or flash temperature = - n-C4H10 0.54 0.186/0.54 = 0.345
81°F
2 i-C4H10 0.77 0.204/0.77 = 0.265
Assume: F (feed) = 100 n-C5H12 0.16 0.031/0.16 = 0.1935
Pressure: = 75 psia; then tabulating the calculations: 0.9789
Compe FeedMol. - z Fx This should be = 1-00. Inaccuracy in reading K values
L
sition Frac.,x YV Ka81"F VK 1 +VK W-l+L/vK probably accounts for most of the difference.
C& 0.15 6.6 0.352 1.352 11.1
C3H, 0.15 i] 2.34 1.78 1.31 2.31 6.5 Didlation operating pxeasureS
nC4H10 0.30 0.54 4.32 5.32 5.65
iW10 0.25 25 0.77 3.02 4.09 6.22
nC5Hlp 0.15 15 0.16 14.6 15.6 A96 To determine the proper operating pressure for a dit+
30.43 tillation system, whether trays or packed column, exam-