
Page 349 - Applied Process Design For Chemical And Petrochemical Plants Volume II
P. 349
338 Applied Process Design for Chemical and Petrochemical Plants
1 .o
0.8
0.6
0.4
0.3
0.2
I" 0.1
c
-- 0.08
n-
0.06
0.04
0.03
0.02
0.01
Cv, Wsec
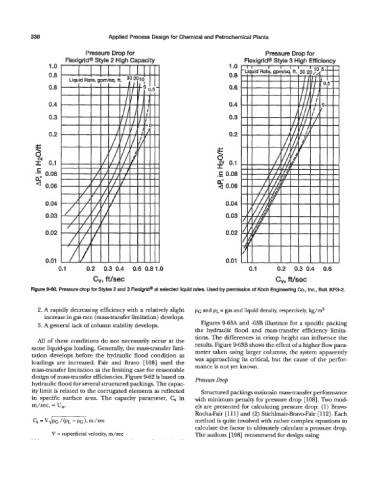
Figure 9-60. Pressure drop for Styles 2 and 3 Flexigrid" at selec 3ed liquid rates. Used b) -2.
2. A rapidly decreasing efficiency with a relatively slight PG and p~ = gas and liquid density, respectively, kg/m3
increase in gas rate (mass-transfer limitation) develops.
3. A general lack of column stability develops. Figures 9-63A and -63B illustrate for a specific packing
the hydraulic flood and mass-transfer efficiency limita-
tions. The differences in crimp height can influence the
All of these conditions do not necessarily occur at the
same liquid-gas loading. Generally, the masstransfer limi- results. Figure 9-63B shows the effect of a higher flow para-
meter taken using larger columns; the system apparently
tation develops before the hydraulic flood condition as
loadings are increased. Fair and Bravo [lo81 used the was approaching its critical, but the cause of the perfor-
mass-transfer limitation as the limiting case for reasonable mance is not yet known.
design of mass-transfer efficiencies. Figure 9-62 is based on Pressure Drop
hydraulic flood for several structured packings. The capac-
ity limit is related to the corrugated elements as reflected Structured packings maintain mass-transfer performance
in specific surface area. The capacity parameter, C, in with minimum penalty for pressure drop [IOS]. Two mod-
m/sec, = U,. els are presented for calculating pressure drop: (1) Bravo-
Rocha-Fair [ 11 11 and (2) Stichlmair-Bravo-Fair [ 1121. Each
C, =vJPG/(PL -PG),m/sec method is quite involved with rather complex equations to
calculate the factor to ultimately calculate a pressure drop.
V = superficial velocity, m/sec The authors [ 1081 recommend for design using