
Page 352 - Applied Process Design For Chemical And Petrochemical Plants Volume II
P. 352
Packed Towers 341
7 6.7 kPa [ 50 mm HE] ETHYLBENZENEISTYRENE
8 689 kPa [loo PSlA ] ISOBUTANEIN-BUTANE
0.0.l 0.02 0.03 0.04 0.06 0.08 0.1 0.2 0.3 0.4 0.6 0.8 1.0
FLOW PARAMETER, X
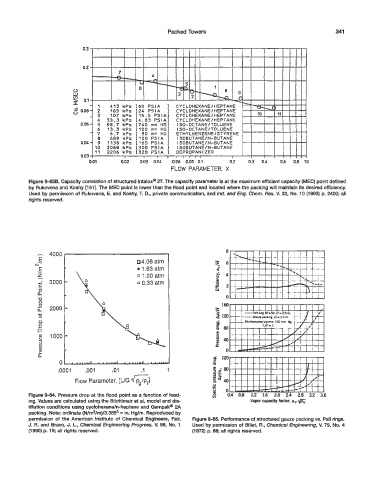
Figure 9-63B. Capacity correlation of structured Intaloxm 2T The capacity parameter is at the maximum efflcient capacity (MEC) point defined
by Rukovena and Koshy [151]. The MEC point is lower than the flood point and located where the packing will maintain its desired efficiency.
Used by permission of Rukovena, E. and Koshy, T. D., private communication, and Ind. and Eng. Chem. Res. V. 32, No. 10 (1993) p. 2400; all
rights reserved.
0 4000K-
E
4.08 atm
@ii 0 1.63 atm
E
z 0 1 .OO atm
\
- a 0.33 atm
.-- 3000
c
.-
a
-0
8 - 1601 I I I : I I I I ! i
2000 I I ! I I I
c
a
a
2
0 - e
1000 I
3 e 40
In p.
v) 0
a
Figure 9-64. Pressure drop at the flood point as a function of load-
ing. Values are calculated using the Stichlmair et al. model and dis-
tillation conditions using cyclohexandn-heptane and Gempaka 2A
packing. Note: ordinate (N/m2/m)/3.3853 I in. Hg/m. Reproduced by
permission of the American Institute of Chemical Engineers, Fair, Figure 9-65. Performance of structured gauze packing vs. Pall rings.
J. R. and Bravo, J. L., Chemical Engineering Progress, V. 86, No. 1 Used by permission of Billet, R., Chemical Engineering, V. 79, No. 4
(1 990) p. 19; alt rights reserved. (1972) p. 68; all rights reserved.