Page 358 - Applied Process Design For Chemical And Petrochemical Plants Volume II
P. 358

Packed Towers                                           347


                 56

             c
             .-   52
             oc
             -0
             - 'Z 48
             .-  -
             0
             In '=
             -0
             c-
             is .3 44
             ma
             cm
             r  .E 40
             on
             .-
             L .cL
             CL
             w   36
                                                                                 = 0.75


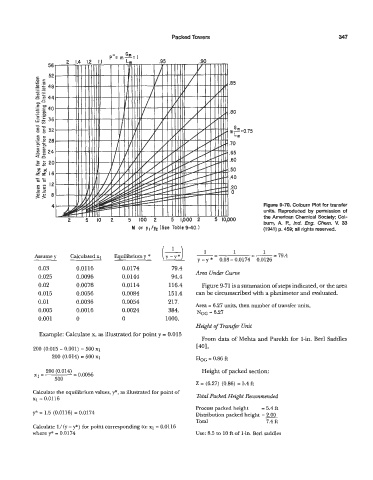
                  4                                                                      Figure 9-70. Colburn Plot for transfer
                                                                                         units.  Reproduced by  permission of
                                                                                         the American Chemical Society; Col-
                                                                                         burn,  A.  P.,  Ind.  Eng.  Chem.  V.  33
                                             M  or  yI/y2  (See  Table9-40.)             (1 941) p. 459; all rights reserved.
                                       Equilibrium y *  (+)


                                                                                         1
                                                                                              79.4
             Assume y    Calculated x1                             -=   1      1     = -
                                                                                            =
                                                                   y - y *  0.03 - 0.0174  0.0126
              0.03        0.0116          0.0174          79.4
              0.025       0.0096          0.0144          94.4    Area Under Curve
              0.02        0.0076          0.01 14        116.4      Figure 9-71 is a summation of steps indicated, or the area
              0.015       0.0056          0.0084         151.4    can be circumscribed with a planimeter and evaluated.
              0.01        0.0036          0.0054         217.     Area = 6.27 units, then number of transfer units,
              0.005       0.0016          0.0024         384.     NOG = 6.27
              0.001       0               0             1000.
                                                                  Height of  Transfer Unit
              Example: Calculate x, as illustrated for pointy = 0.015
                                                                    From data of Mehta and Parekh for 1-in. Berl Saddles
            200 (0.015 - 0.001) = 500 ~1                          ~401,
                  200 (0.014) = 500 XI                            HOG = 0.86 ft
                                                                    Height of packed section:

                                                                  Z = (6.27) (0.86) = 3.4 ft
            Calculate the equilibrium values, p, as illustrated for point of
            XI = 0.0116                                           Total Packed Height Recommended
                                                                  Process packed height   = 5.4 ft
            y" = 1.5 (0.0116) = 0.0174                            Distribution packed height = 2.00
                                                                  Total                  7.4 ft
            Calculate l/(y  - y*)  for point corresponding to: x1 = 0.0116
            where y*  = 0.0174                                    Use: 8.5 to 10 ft of 1-in. Berl saddles
   353   354   355   356   357   358   359   360   361   362   363