
Page 359 - Applied Process Design For Chemical And Petrochemical Plants Volume II
P. 359
348 Applied Process Design for Chemical and Petrochemical Plants
If N = 6.4 were used for the tower:
- 6.4 (0.86) = 5.5 ft minimum for process operations
Example 9-11: Number Transfer Units-Concentrated
Solutions
Using the basic problem for dilute solutions, assume the
following conditions for a higher concentration.
G' = 200 mol gas/hr (ftz)
L' = 500 mol water/hr (ft2)
y1 = 0.30 (inlet)
y2 = 0.01 (outlet)
x2 = 0
y* = 1.54
Material Balance
Based on inert gas
Gasphasechange=G' (l-yl) [I:, --- 1:Py2]
[+-I
Liquid phase change =
-
L' [ x 3-1 = L' [ +L - 0]
1-x 1-x -X
Y
These changes must be equal:
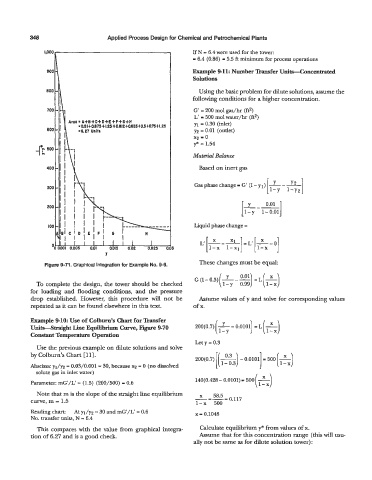
Figure 9-71. Graphical integration for Example No. 9-9.
-
G (1- 0.3) ( y - 9) L)
L(
To complete the design, the tower should be checked 1-y 0.99 I-x
for loading and flooding conditions, and the pressure
drop established. However, this procedure will not be Assume values of y and solve for corresponding values
repeated as it can be found elsewhere in this text. of x.
Example 9-10: Use of Colburn's mart for Transfer
UniMtraight Line Equilibrium Curve, Figure 970
Constant Temperature Operation
Let y = 0.3
Use the previous example on dilute solutions and solve
by Colburn's Chart [ll], 200(0.7) [ (s) (z)
-
-
500
1
1-x
O.OlOI]
0.3
=
Abscissa: yl/y2 = 0.03/0.001 = 30, because x2 = 0 (no dissolved
solute gas in inlet water)
140(0.428 - 0.0101) = 500 -
Parameter: mG'/L' = (1.5) (200/500) = 0.6 ( l:x)
Note that m is the slope of the straight line equilibrium
curve, m = 1.5 -=-= 58'5 0.117
1-x
500
Reading chart: At y1/y2 30 and mG'/L' = 0.6 x = 0.1048
No. transfer units, N = 6.4
This compares with the value from graphical integra- Calculate equilibrium y* from values of x.
tion of 6.27 and is a good check. Assume that for this concentration range (this will usu-
ally not be same as for dilute solution tower):