
Page 367 - Applied Process Design For Chemical And Petrochemical Plants Volume II
P. 367
356 Applied Process Design for Chemical and Petrochemical Plants
(text ccmtinuedhm page 353)
*n, *-Q -Q x, mole Lb. NH3 *Adiabatic
g. moles p.c.u./lb Btu/lb fraction per loo# Temp.
H20 mole NH3 NH3 NHs H20 rise, "F
1 6,600 698 0.5 94.5 338
2.33 7,820 829 0.3 40.5 238
4 8,040 851 0.2 23.6 164
9 8,220 873 0.1 10.5 83
19 8,290 879 0.05 4.97 41.6
49 8,580 906 0.02 1.93 17.1
Data on heats of solution of ammonia taken from International
Critical Tables Vol. V, pg. 213 [35] by Sherwood and Pigford
(Absorption and Extraction, pg. 161, 2nd Ed., McGraw Hill Book
Co., Inc.) Ref. 63*.
1. Assume values for Y, (0.012 for example) mol amme
nia/mol of inert gas and read corresponding vapor
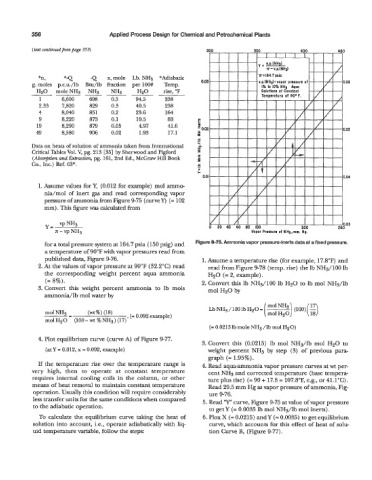
pressure of ammonia from Figure 9-75 (curve Y) (= 102
mm) . This figure was calculated from
for a total pressure system at 164.7 psia (150 psig) and Figure 9-75. Ammonia vapor pressure-inerts data at a fixed pressure.
a temperature of 90°F with vapor pressures read from
published data, Figure 9-76. 1. Assume a temperature rise (for example, 17.8"F) and
2. At the values of vapor pressure at 90°F (32.2"C) read read from Figure 9-78 (temp. rise) the lb NH3/100 lb
the corresponding weight percent aqua ammonia H20 (= 2, example).
(= 8%). 2. Convert this lb NH3/lOO lb H20 to lb mol NH3/lb
3. Convert this weight percent ammonia to lb mols mol H20 by
ammonia/lb mol water by
( mol NH3 \ 17
Lb NH3 /lo0 lb H20 = (100) -
(moiH20) (18)
(= 0.0215 lb mole NH3 /Ib mol H20)
4. Plot equilibrium curve (curve A) of Figure 9-77.
Convert this (0.0215) lb mol NHs/lb mol H20 to
(atY = 0.012, x = 0.092, example) weight percent NH3 by step (3) of previous para-
graph (= 1.95%).
If the temperature rise over the temperature range is Read aqua-ammonia vapor pressure curves at wt per-
very high, then to operate at constant temperature cent NH3 and corrected temperature (base tempera-
requires internal cooling coils in the column, or other ture plus rise) (= 90 + 17.8 = 107.8"F, e.g., or 41.1"C).
means of heat removal to maintain constant temperature Read 29.5 mm Hg as vapor pressure of ammonia, Fig-
operation. Usually this condition will require considerably ure 9-76.
less transfer units for the same conditions when compared Read 'Y" curve, Figure 9-75 at value of vapor pressure
to the adiabatic operation.
to get Y (= 0.0035 lb mol NHs/lb mol inerts).
To calculate the equilibrium curve taking the heat of Plox X (= 0.0215) andY (= 0.0035) to get equilibrium
solution into account, i.e., operate adiabatically with liq- curve, which accounts for this effect of heat of solu-
uid temperature variable, follow the steps: tion Curve B, (Figure 9-77).