
Page 377 - Applied Statistics And Probability For Engineers
P. 377
c09.qxd 5/15/02 8:02 PM Page 325 RK UL 9 RK UL 9:Desktop Folder:
9-8 CONTINGENCY TABLE TESTS 325
(b) Explain why the sample standard deviation, s 0.00001, (c) Do these data appear to be well modeled by a normal dis-
is less than 0.00002, yet the statistical test procedure re- tribution? Use a formal goodness-of-fit test in answering
sults do not support the claim. this question.
9-82. A biotechnology company produces a therapeutic 9-88. Consider the baseball coefficient of restitution data
drug whose concentration has a standard deviation of 4 grams in Exercise 8-79. If the mean coefficient of restitution ex-
per liter. A new method of producing this drug has been pro- ceeds 0.635, the population of balls from which the sample
posed, although some additional cost is involved. Management has been taken will be too “lively” and considered unaccept-
will authorize a change in production technique only if the able for play.
standard deviation of the concentration in the new process is (a) Formulate an appropriate hypothesis testing procedure to
less than 4 grams per liter. The researchers chose n 10 and answer this question.
obtained the following data in grams per liter. Perform the nec- (b) Test these hypotheses using the data in Exercise 8-79 and
essary analysis to determine whether a change in production draw conclusions, using 0.01.
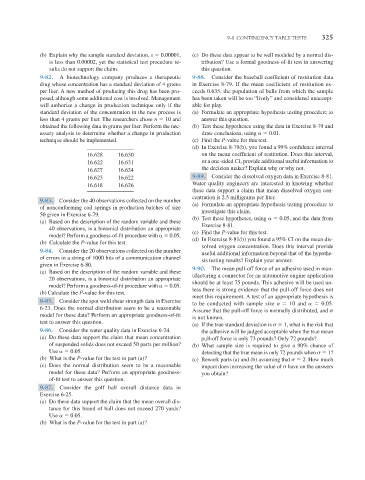
technique should be implemented. (c) Find the P-value for this test.
(d) In Exercise 8-79(b), you found a 99% confidence interval
16.628 16.630 on the mean coefficient of restitution. Does this interval,
16.622 16.631 or a one-sided CI, provide additional useful information to
16.627 16.624 the decision maker? Explain why or why not.
16.623 16.622 9-89. Consider the dissolved oxygen data in Exercise 8-81.
16.618 16.626 Water quality engineers are interested in knowing whether
these data support a claim that mean dissolved oxygen con-
centration is 2.5 milligrams per liter.
9-83. Consider the 40 observations collected on the number
(a) Formulate an appropriate hypothesis testing procedure to
of nonconforming coil springs in production batches of size
investigate this claim.
50 given in Exercise 6-79.
(b) Test these hypotheses, using 0.05, and the data from
(a) Based on the description of the random variable and these
Exercise 8-81.
40 observations, is a binomial distribution an appropriate
(c) Find the P-value for this test.
model? Perform a goodness-of-fit procedure with 0.05.
(d) In Exercise 8-81(b) you found a 95% CI on the mean dis-
(b) Calculate the P-value for this test.
solved oxygen concentration. Does this interval provide
9-84. Consider the 20 observations collected on the number
useful additional information beyond that of the hypothe-
of errors in a string of 1000 bits of a communication channel
sis testing results? Explain your answer.
given in Exercise 6-80.
9-90. The mean pull-off force of an adhesive used in man-
(a) Based on the description of the random variable and these
ufacturing a connector for an automotive engine application
20 observations, is a binomial distribution an appropriate
should be at least 75 pounds. This adhesive will be used un-
model? Perform a goodness-of-fit procedure with 0.05.
less there is strong evidence that the pull-off force does not
(b) Calculate the P-value for this test.
meet this requirement. A test of an appropriate hypothesis is
9-85. Consider the spot weld shear strength data in Exercise
to be conducted with sample size n 10 and 0.05.
6-23. Does the normal distribution seem to be a reasonable
Assume that the pull-off force is normally distributed, and
model for these data? Perform an appropriate goodness-of-fit
is not known.
test to answer this question.
(a) If the true standard deviation is 1, what is the risk that
9-86. Consider the water quality data in Exercise 6-24. the adhesive will be judged acceptable when the true mean
(a) Do these data support the claim that mean concentration pull-off force is only 73 pounds? Only 72 pounds?
of suspended solids does not exceed 50 parts per million? (b) What sample size is required to give a 90% chance of
Use 0.05. detecting that the true mean is only 72 pounds when 1?
(b) What is the P-value for the test in part (a)? (c) Rework parts (a) and (b) assuming that 2. How much
(c) Does the normal distribution seem to be a reasonable impact does increasing the value of have on the answers
model for these data? Perform an appropriate goodness- you obtain?
of-fit test to answer this question.
9-87. Consider the golf ball overall distance data in
Exercise 6-25.
(a) Do these data support the claim that the mean overall dis-
tance for this brand of ball does not exceed 270 yards?
Use 0.05.
(b) What is the P-value for the test in part (a)?