
Page 372 - Applied Statistics And Probability For Engineers
P. 372
c09.qxd 5/16/02 4:15 PM Page 320 RK UL 6 RK UL 6:Desktop Folder:TEMP WORK:MONTGOMERY:REVISES UPLO D CH114 FIN L:Quark Files:
320 CHAPTER 9 TESTS OF HYPOTHESES FOR A SINGLE SAMPLE
9-63. Define X as the number of underfilled bottles from a
Vehicles Vehicles
filling operation in a carton of 24 bottles. Sixty cartons are
per Observed per Observed
inspected and the following observations on X are recorded:
Minute Frequency Minute Frequency
Values 0 1 2 3 40 14 53 102
Frequency 39 23 12 1 41 24 54 96
42 57 55 90
(a) Based on these 75 observations, is a binomial distribution
43 111 56 81
an appropriate model? Perform a goodness-of-fit proce-
44 194 57 73
dure with 0.05.
(b) Calculate the P-value for this test. 45 256 58 64
9-64. The number of cars passing eastbound through the in- 46 296 59 61
tersection of Mill and University Avenues has been tabulated 47 378 60 59
by a group of civil engineering students. They have obtained 48 250 61 50
the data in the adjacent table:
49 185 62 42
(a) Does the assumption of a Poisson distribution seem
50 171 63 29
appropriate as a probability model for this process? Use
0.05. 51 150 64 18
(b) Calculate the P-value for this test. 52 110 65 15
9-8 CONTINGENCY TABLE TESTS
Many times, the n elements of a sample from a population may be classified according to two
different criteria. It is then of interest to know whether the two methods of classification are
statistically independent; for example, we may consider the population of graduating engi-
neers, and we may wish to determine whether starting salary is independent of academic dis-
ciplines. Assume that the first method of classification has r levels and that the second method
has c levels. We will let O be the observed frequency for level i of the first classification
ij
method and level j on the second classification method. The data would, in general, appear as
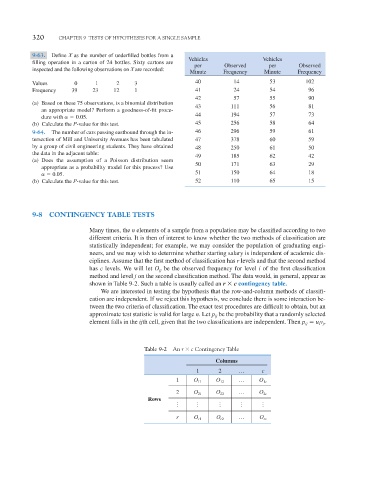
shown in Table 9-2. Such a table is usually called an r c contingency table.
We are interested in testing the hypothesis that the row-and-column methods of classifi-
cation are independent. If we reject this hypothesis, we conclude there is some interaction be-
tween the two criteria of classification. The exact test procedures are difficult to obtain, but an
approximate test statistic is valid for large n. Let p be the probability that a randomly selected
ij
element falls in the ijth cell, given that the two classifications are independent. Then p u v ,
ij
i j
Table 9-2 An r c Contingency Table
Columns
1 2 p c
1 O 11 O 12 p O 1c
2 O 21 O 22 p O 2c
Rows
o o o o o
r O r1 O r2 p O rc