Page 373 - Applied Statistics And Probability For Engineers
P. 373

c09.qxd  5/16/02  4:15 PM  Page 321 RK UL 6 RK UL 6:Desktop Folder:TEMP WORK:MONTGOMERY:REVISES UPLO D CH114 FIN L:Quark Files:


                                                                            9-8 CONTINGENCY TABLE TESTS   321


                                   where u is the probability that a randomly selected element falls in row class i and v is the
                                          i
                                                                                                        j
                                   probability that a randomly selected element falls in column class j. Now, assuming inde-
                                   pendence, the estimators of u and v are
                                                                j
                                                           i
                                                                       1  c
                                                                       n a
                                                                     u ˆ i      O ij
                                                                         j 1
                                                                       1  r
                                                                       n a
                                                                     v ˆ       O ij                      (9-40)
                                                                    j
                                                                          i 1
                                   Therefore, the expected frequency of each cell is
                                                                        1  c    r
                                                             E   nu ˆ v ˆ    n a  O ij a  O ij           (9-41)
                                                                    i j
                                                              ij
                                                                          j 1  i 1
                                   Then, for large n, the statistic

                                                                    r  c  1O   E 2 2
                                                                                 ij
                                                                            ij
                                                               2
                                                                0    a a                                 (9-42)
                                                                   i 1 j 1   E ij
                                   has an approximate chi-square distribution with (r   1)(c   1) degrees of freedom if the null
                                   hypothesis is true. Therefore, we would reject the hypothesis of independence if the observed
                                                        2         2
                                   value of the test statistic   0  exceeded    ,(r 1)(c 1) .
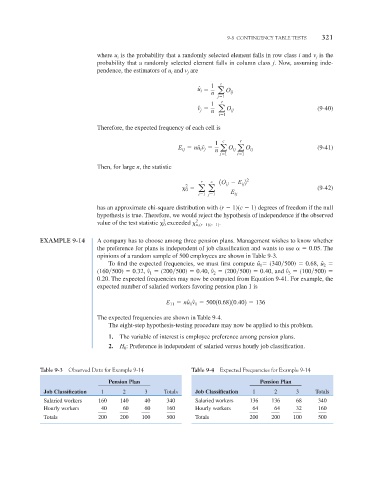
                 EXAMPLE 9-14      A company has to choose among three pension plans. Management wishes to know whether
                                   the preference for plans is independent of job classification and wants to use    0.05. The
                                   opinions of a random sample of 500 employees are shown in Table 9-3.
                                       To find the expected frequencies, we must first compute    (340 500)   0.68, u ˆˆ u 1  2
                                   (160 500)   0.32, v ˆ 1    (200 500)   0.40, v ˆ 2    (200 500)   0.40, and v ˆ 3    (100 500)
                                   0.20. The expected frequencies may now be computed from Equation 9-41. For example, the
                                   expected number of salaried workers favoring pension plan 1 is

                                                              nu ˆ v ˆ   50010.68210.402   136
                                                         E 11   1 1
                                   The expected frequencies are shown in Table 9-4.
                                       The eight-step hypothesis-testing procedure may now be applied to this problem.
                                       1.  The variable of interest is employee preference among pension plans.
                                       2.  H 0 : Preference is independent of salaried versus hourly job classification.


                 Table 9-3  Observed Data for Example 9-14       Table 9-4  Expected Frequencies for Example 9-14

                                       Pension Plan                                    Pension Plan
                  Job Classification  1     2      3     Totals    Job Classification  1     2      3     Totals
                  Salaried workers  160   140     40     340      Salaried workers  136   136     68     340
                  Hourly workers    40     60     60     160      Hourly workers    64     64     32     160
                  Totals            200   200    100     500      Totals           200    200    100     500
   368   369   370   371   372   373   374   375   376   377   378