Page 374 - Applied Statistics And Probability For Engineers
P. 374

c09.qxd  5/15/02  8:02 PM  Page 322 RK UL 9 RK UL 9:Desktop Folder:


               322     CHAPTER 9 TESTS OF HYPOTHESES FOR A SINGLE SAMPLE


                                    3.  H : Preference is not independent of salaried versus hourly job classification.
                                         1
                                    4.  	  0.05
                                    5.  The test statistic is


                                                                  r  c 1o 
 E 2 2
                                                                              ij
                                                                         ij
                                                             2
                                                                 a a
                                                             0
                                                                 i 1 j 1   E ij
                                    6.  Since r   2 and c   3, the degrees of freedom for chi-square are (r 
 1)(c 
 1)
                                                                      2
                                                                    if      2    5.99.
                                        (1)(2)   2, and we would reject H 0  0  0.05,2
                                    7.  Computations:
                                                 2  3 1o 
 E 2 2
                                                        ij
                                                             ij
                                            2
                                               0    a a
                                                i 1 j 1   E ij
                                                1160 
 1362 2  1140 
 1362 2  140 
 682 2  140 
 642 2

                                                    136           136          68          64
                                                  160 
 642 2  160 
 322 2
                                                                          49.63
                                                      64          32
                                                                     2
                                                         2
                                    8.  Conclusions: Since   0   49.63    0.05,2   5.99 , we reject the hypothesis of inde-
                                        pendence and conclude that the preference for pension plans is not independent of
                                                                      2
                                        job classification. The P-value for   0   49.63  is P   1.671   10 
11 . (This value
                                        was computed using a hand-held calculator.) Further analysis would be necessary to
                                        explore the nature of the association between these factors. It might be helpful to
                                        examine the table of observed minus expected frequencies.
                                    Using the two-way contingency table to test independence between two variables of
                                 classification in a sample from a single population of interest is only one application of con-
                                 tingency table methods. Another common situation occurs when there are r populations of
                                 interest and each population is divided into the same c categories. A sample is then taken from
                                 the ith population, and the counts are entered in the appropriate columns of the ith row. In this
                                 situation we want to investigate whether or not the proportions in the c categories are the same
                                 for all populations. The null hypothesis in this problem states that the populations are homo-
                                 geneous with respect to the categories. For example, when there are only two categories, such
                                 as success and failure, defective and nondefective, and so on, the test for homogeneity is really
                                 a test of the equality of r binomial parameters. Calculation of expected frequencies, determi-
                                 nation of degrees of freedom, and computation of the chi-square statistic for the test for ho-
                                 mogeneity are identical to the test for independence.


               EXERCISES FOR SECTION 9-8
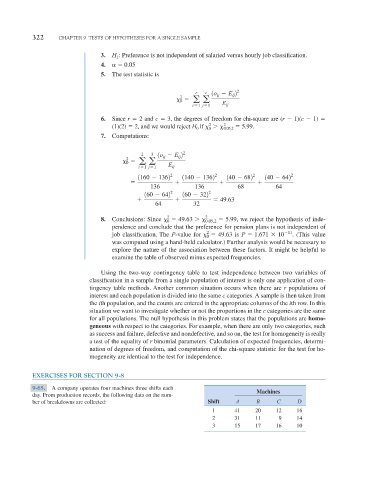
               9-65.  A company operates four machines three shifts each
                                                                                     Machines
               day. From production records, the following data on the num-
               ber of breakdowns are collected:                       Shift    A     B      C     D
                                                                       1      41     20     12    16
                                                                       2      31     11     9     14
                                                                       3      15     17     16    10
   369   370   371   372   373   374   375   376   377   378   379